Last week, we re-viz-ited our first application visualizations for The Data School New York. Our goal was to enhance our submission with more data and Tableau best practices. Before I dive into my resulting dashboard, let’s review what I did.
In July, I completed my capstone project on Asian hate crimes. Hence, I reworked that project into my application viz:

I am still proud of my work. However, in my new take on this visualization, I planned to avoid the double encoding with the color gradient and remove the sort controls. I also intended to include a per capita analysis to normalize anti-Asian hate crimes by population.
I redownloaded the dataset from NYC Open Data and noticed it was last updated on October 19, 2022! My purpose for this recreation is to bring this visualization up to date and at the same time, examine how anti-Asian hate crimes changed from last year.
With a clear vision, I found population data and prepared it in Alteryx; I reduced the population data down to the overall and Asian populations by borough in 2020, before joining the population data and hate crime data in Tableau.
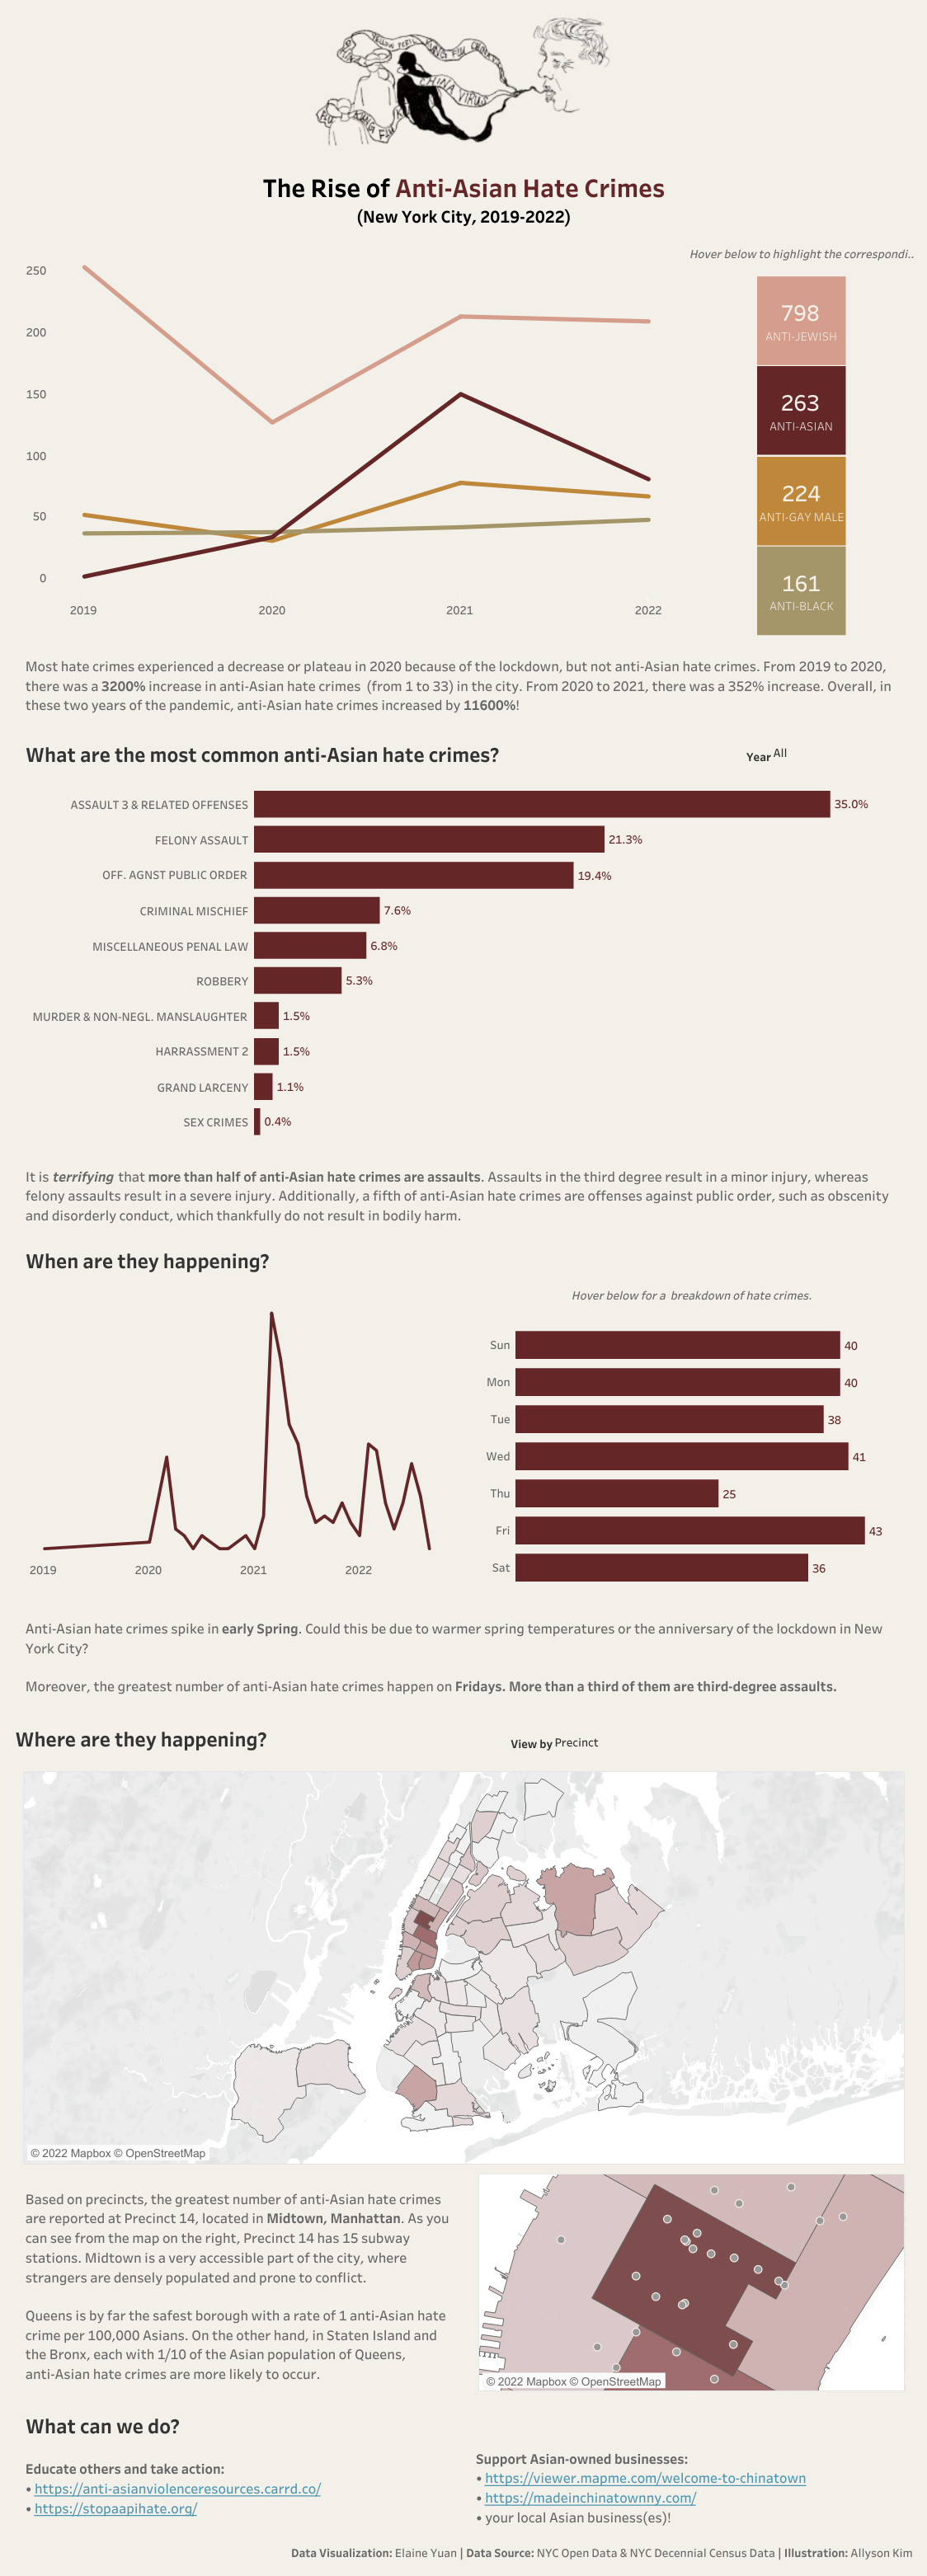
I still like the design of my first application visualization. Therefore, I kept the same infographic style and color scheme, while including new features, such as highlighting functionality and chart flipping to offer different views. After all the edits, this is the second iteration of my first application visualization:

I found that, although 2022 is not over yet, the count of anti-Asian hate crimes in New York City has decreased 46% from 2021 to 2022. Despite this decrease, a frightening number of anti-Asian hate crimes in 2022 are assaults - either third degree or felony assaults. Anti-Asian hate crimes are no longer getting the same media attention as they once were during the pandemic, but Asian hate remains an ongoing issue in the city I call home.
