


The Modern Data Skyline: Storage Options Through a Tour of New York City
In the past, data storage might have conjured up images of a folder full of excel files on a computer or server, or perhaps some tables stored on a server machine in the cupboard. In either case we might compare this to a single filing cabinet organised in slightly different ways but ultimately fixed in size and (generally) small in scale.
Compare that to modern options that appear much larger in size and scope but also distinct in how that data is stored.
The On-Prem Warehouse: New York Public Library, a historic landmark (in the sense this emerged before some of the options to come), books are organized on shelves in sections. A key consideration is that you cannot simply check in videos or magazines to the library and walk off. The shelves have been made with certain books in mind. The brick and stone of the building need to be looked after and its not straightforward to simply extend the building.
Your library doesn't necessarily have to be so large and grand (it might be a smaller library on the Upper West Side but the staffing of the library is linked to the size of the building, you might have less shelves but ultimately you are expecting books of a certain size that can be placed on the shelves.

The Data Lake: the Jacqueline Kennedy Reservoir in Central Park, a vast open body of water that you can pour anything into (don’t actually do this!), log files, JSON files, spreadsheets. The challenge is that without a good way to navigate the reservoir things get lost, things grow and sprawl out of control and the reservoir begins to look more like a dirty swamp.

The Cloud Data Warehouse (e.g. Snowflake): The Javits Center located by Hudson Yards, a huge venue with ample space for the setup of numerous stalls (data store) for huge events like Comic-Con with plenty of staff to run the event (compute here). Yet also capable of running a small trade show with a small set of staff and only a portion of the venue. The key here is a separation of the storage and compute, so that the compute can be scaled up and down as per requirement.

The Data Lakehouse (e.g. Databricks): Think of this as the Port of New York and New Jersey, a modern port built on the edge of a vast data lake (the Atlantic Ocean), goods are stored in the world standard, shipping containers. In data that would look like Delta Lake or Iceberg Tables, they are on the high seas but in an organized manner and can be accessed through the port including all the shipping logs that capture where the goods have been shipped where items have been loaded and unloaded.

What about this DuckDB?: Perhaps think of this as the NYC Ferry Service rather than a building or port that you go through to get the data, a path is specified to the underlying storage (like a ferry route to a specific station, such as an S3 bucket of parquet files). DuckDB and similar tools are less a place and more a means of reading your data where it lives and bringing the answers back to you.

What’s the impact on Analytics?
Row-based v. Column-based Storage
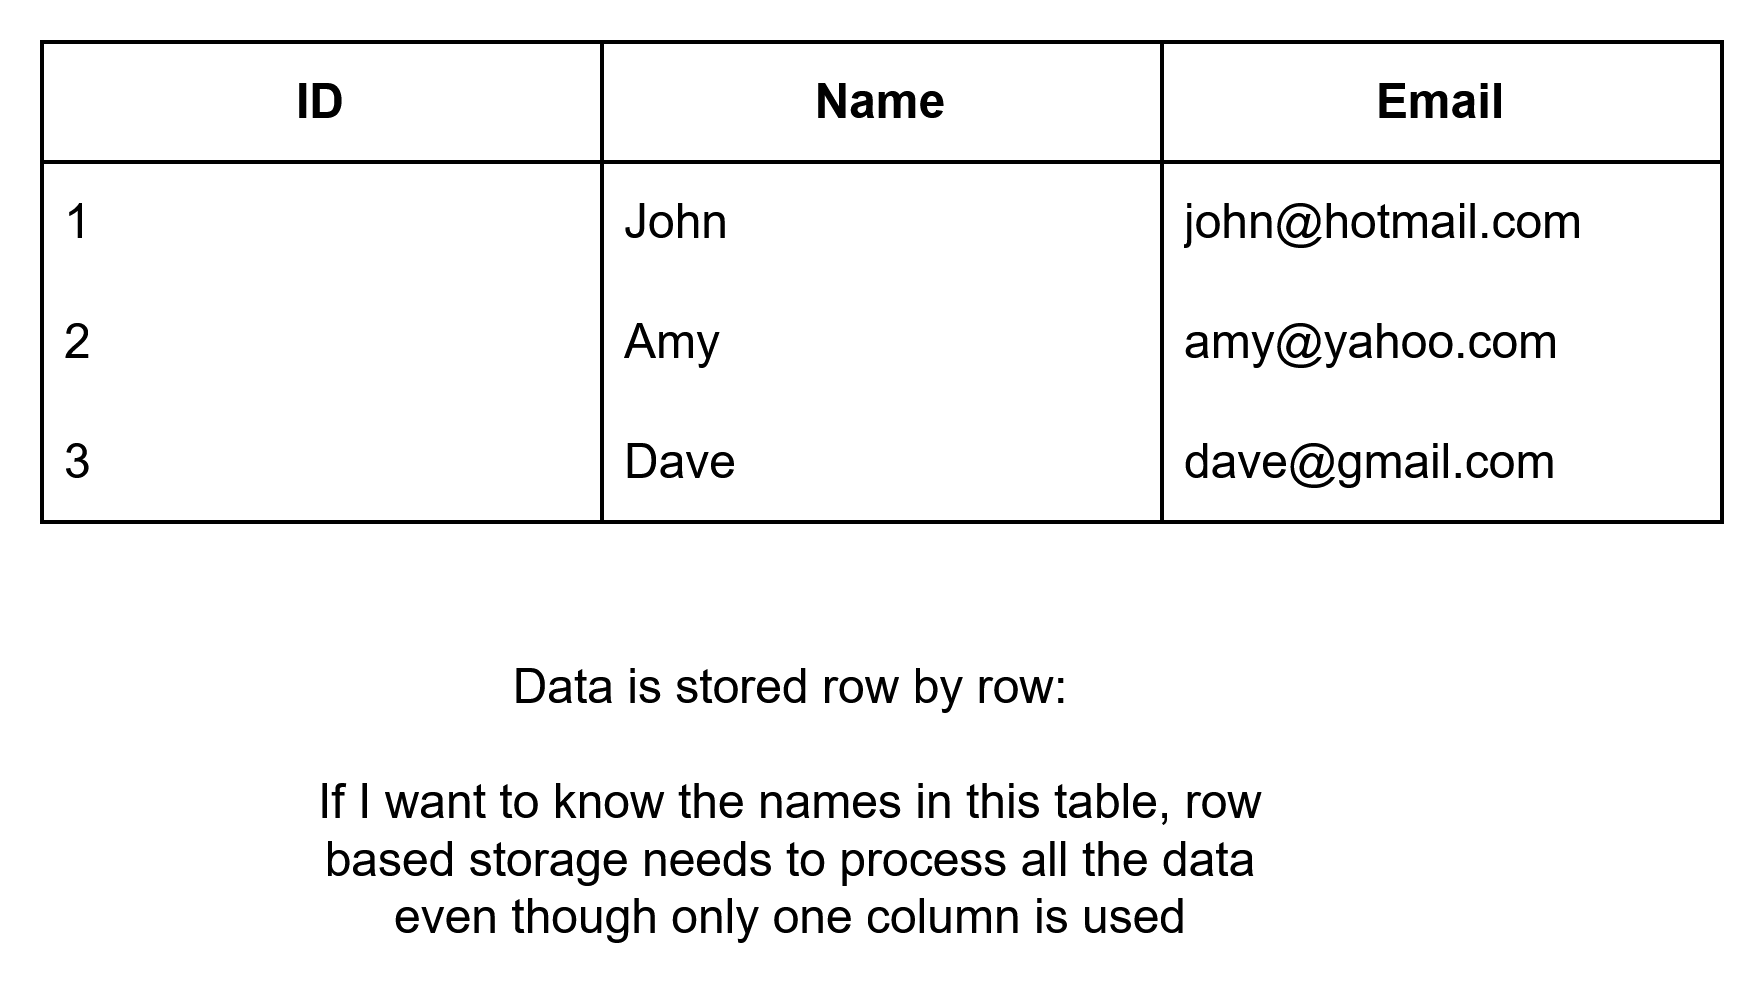
- Row-based storage is typical in OLTP systems (Online Transaction Processing) that emphasises the ease of inserting new data as rows into the database.
- Hence it makes sense for transactional settings like a point of sale system where new entries are regularly being added to the datastore.
- Weaker for analytics, as finding the average of a given metric requires reading entire rows of unnecessary information, even when only one column is of interest.
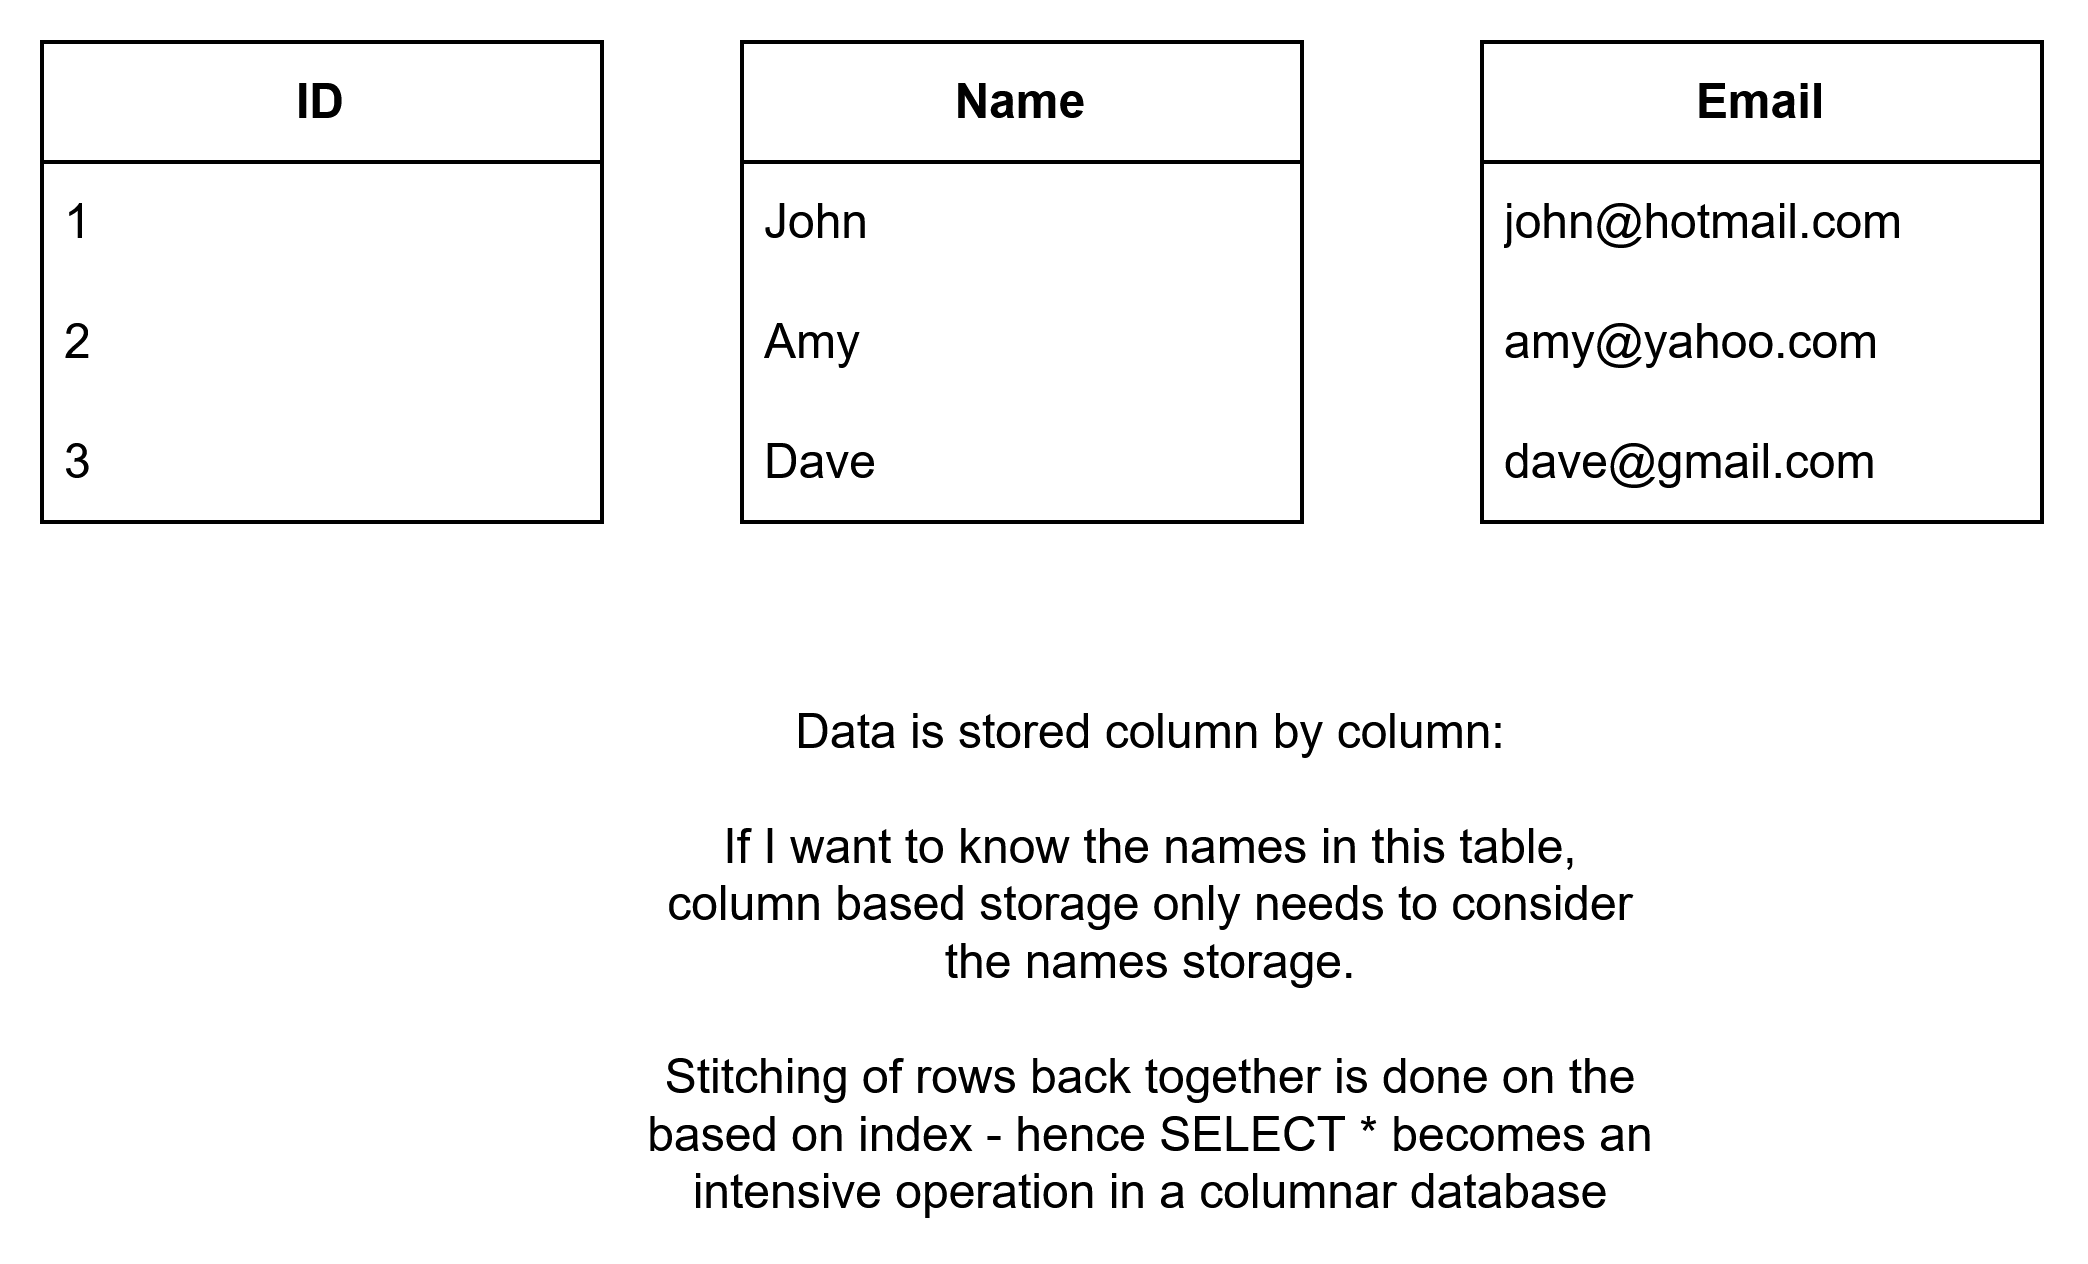
- Columnar-based storage is typical in OLAP systems (Online Analytical Processing) that emphasises the need to retrieve data quickly and reduce the amount of information that needs to be considered in order to deliver answers.
- In analytics you might want to return the average of a given metric, in row based all rows would have to be considered but in columnar store this aggregation can be made simply off the metric's own column.
- Writing in new transactions becomes a challenge because the information is disparately stored across different files.
Tooling Changes Fast - a non-exhaustive snapshot of the current state of play
The Cloud Data Warehouse
Often managed, SQL-first platforms for BI and Analytics, like the Javits Center.
Examples include: Snowflake, Google BigQuery, Amazon Redshift, Microsoft Synapse Analytics.
The Data Lakehouse Platform
Unifies warehousing, ML workloads on an open data lake, leveraging open table formats like Delta Lake or Iceberg resulting in the Port of New York and New Jersey Model
Examples include: Databricks (using Delta Lake), Starburst (using Trino), AWS Glue Catalog(metadata catalog)/S3(storage)/Athena(Serverless Compute).
The In-Process Analytics Engine
Rather than a building, it brings the analytics to your machine, connecting to wherever your data already lives (e.g. an S3 bucket full of Parquet files. The In-Process Analytics Engine never takes the data per se, simply goes to where it has been told the data is, runs the process/query and returns to you with the answer.
Examples include: DuckDB, Poalrs
The Real-Time Warehouse
Designed to emphasise high concurrency workloads relative to a traditional cloud warehouse (avoid queueing), high degrees of compression for massive datasets.
Examples include: ClickHouse
The Transactional Database
The classic row-based database, typically a backbone of an organisation as it's common for BI and analytics to be built on transactional information.
Examples include: PostgreSQL, MySQL, Microsoft SQL Server.