


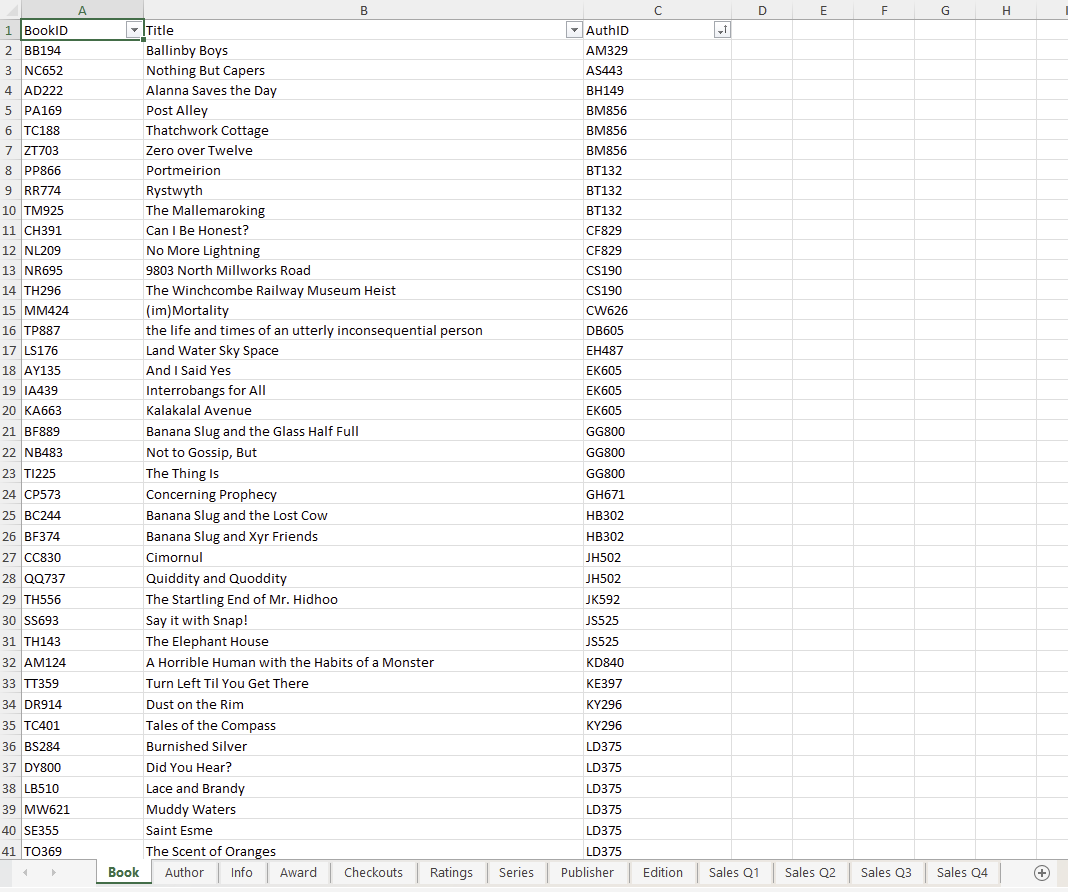
Yesterday Coach Carl gave us a dataset for a hypothetical bookshop and told us to produce a single Tableau Data Source ready for analysis in 40/45 minutes before turning into Client Carl. A snapshot of the dataset is included below:
On reflection there were a few things that I did right, a few things I did wrong, and things that were probably out of my scope of knowledge at the time but that I will bear in mind when confronted with similar future challenges.
The first thing I did when out time started was the right thing look at the dataset and take note of some of the details. I noted down levels of granularity, books in a few like the Book Sheet, Order in the Sales Sheets and Review in the Ratings Sheet. I also noted down potential join clauses - such as BookID and IBSN. Turning to my first mistake - I failed to translate these notes into logical notes I could call back to or sensibly develop my next step. Below is a recreation in excalidraw of the nature of my notes.
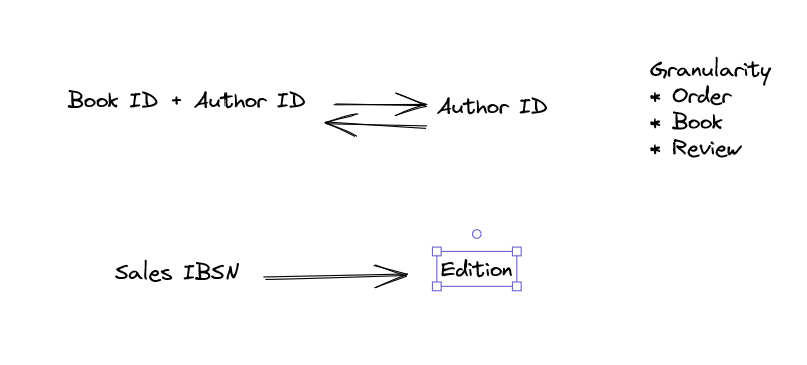
The content of this sample of the notes is not inaccurate the join terms are correctly identified but the strategy had no formulaic nature and was scrambled. A table structure organizing the information by sheet would have been more sensible at identifying which tables meshed together and which did not.
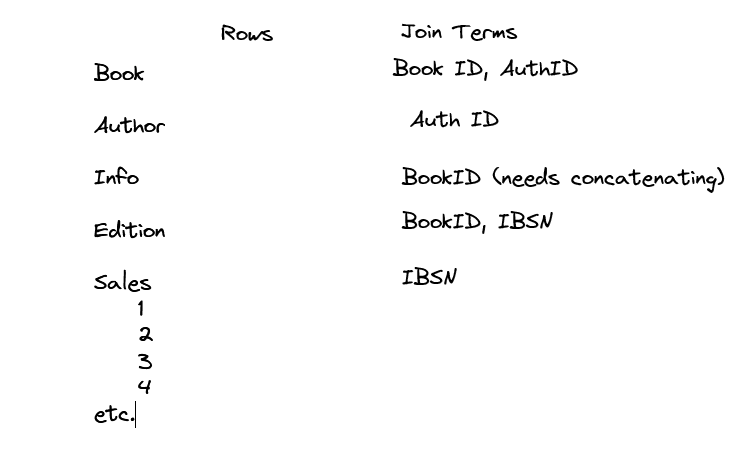
This structure makes it clear what can be joined with what and how they relate as a whole to creating a single dataset.
Turning to the empty column for rows: this is another thing I got wrong but I was not far off. I did not note down the rows but was concious of the amount of rows ballooning. Taking note of the rows allows you to set this context before you work rather than trying to adjust on the fly at every stage of the prep.
I noticed that Order seemed to be both the most important and most granular of the sheets so started correctly by unioning those tables given that they had the same columns. But not planning out in advance meant I was not disciplined enough when it came to introducing the other tables. This should have set the logic of any future joins - any decrease would mean losing cases, any increase and this would mean some form of duplication. Both issues.
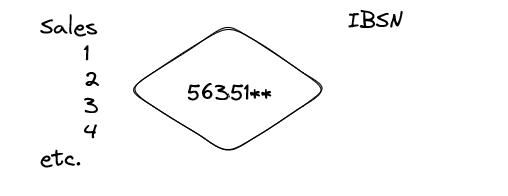
A note like this sets context for processing when something in the prep stage has gone wrong.
Turning to the soft-skill side of the exericise, multiple times I raised my concern with Client Carl about joining more rows and suggested I leave certain sheets out of the datasource which was meant with words to the effect of "this leaves the challenge incomplete". Reflecting on the exercise I know realize that in my engagements with Client Carl I did not verbalize or explain my concerns about joining datasets so its no suprise that I did not generate a productive conversation with the client. If I had explained the idea of granularity or even in less jargon terms the confusion of joining data about book loans at a monthly level with book sales at a specific date level I might have had more luck breaking through.
In the end I made the mistake of just giving in and joing all the data and letting the rows balloon in size. Part of this was absolutely a failure of soft-skills but also a failure in technical skills. Not understanding what a Tableau Data Source was (which I could have googled) when Client Carl kept mentioning it might have led me to realize that in Tableau I had the flexibility of both physical relationships (like traditional prep) and logical relationships. Although the latter relationships are a black box in terms of how they work they do offer me the opportunity to deliver what the client wants in this case with the qualifier that we cannot control exactly what happens "under the hood" of a logical relationship.
This leads the the final product:
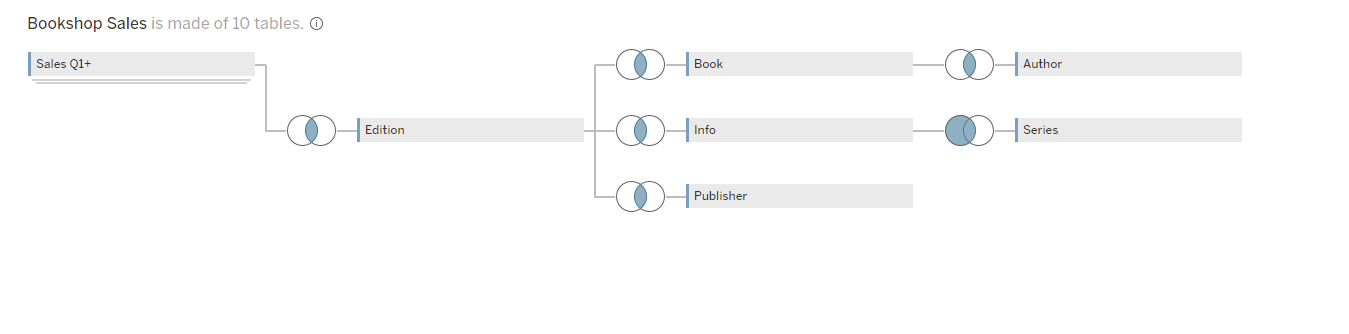
All the physical relationships above that can be joined to the unioned sales data without duplicating or excluding cases and the sheets that cannot be joined physically but can be logically related to the base table:
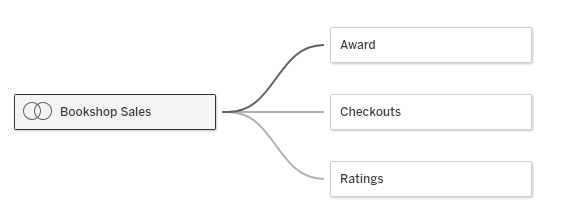
Tableau can then call on these tables when it makes sense to and join them in the way it deems most appropriate for the context in which it is deployed. Thus satisfying the requirement that we produce a single Tableau Data Source that contains all the sheets in some form.
This challenge wasn't reflective of future client work. I would have had the ability to draw on the experience of colleagues in the office for some of my questions I might have had about the Tableau Data Model. But it did have some valuable lessons:
- Approaching the planning stage with more discipline and organization
- Always take into account row numbers when prepping - it will help contextualize join logic and necessary aggregation.
- Do as much as possible in the physical data options but remember that logical relationships are a potential solution to clients who are comfortable with the technical jargon and the pros and cons associated with any decision to use.
- Verbalize and communicate with the client your concerns and reasoning for those concerns when set with a task.