


The Pareto Principle states that 80% of outcome should come from 20% of causes. This can have value in a business insights setting where in the pursuit of efficiency seeing what products contribute most to revenue or identify which customers give them the most business and ensure the key customers are satisfied.
An example I made below using Superstore Data EU is what I will walk through in this blog:
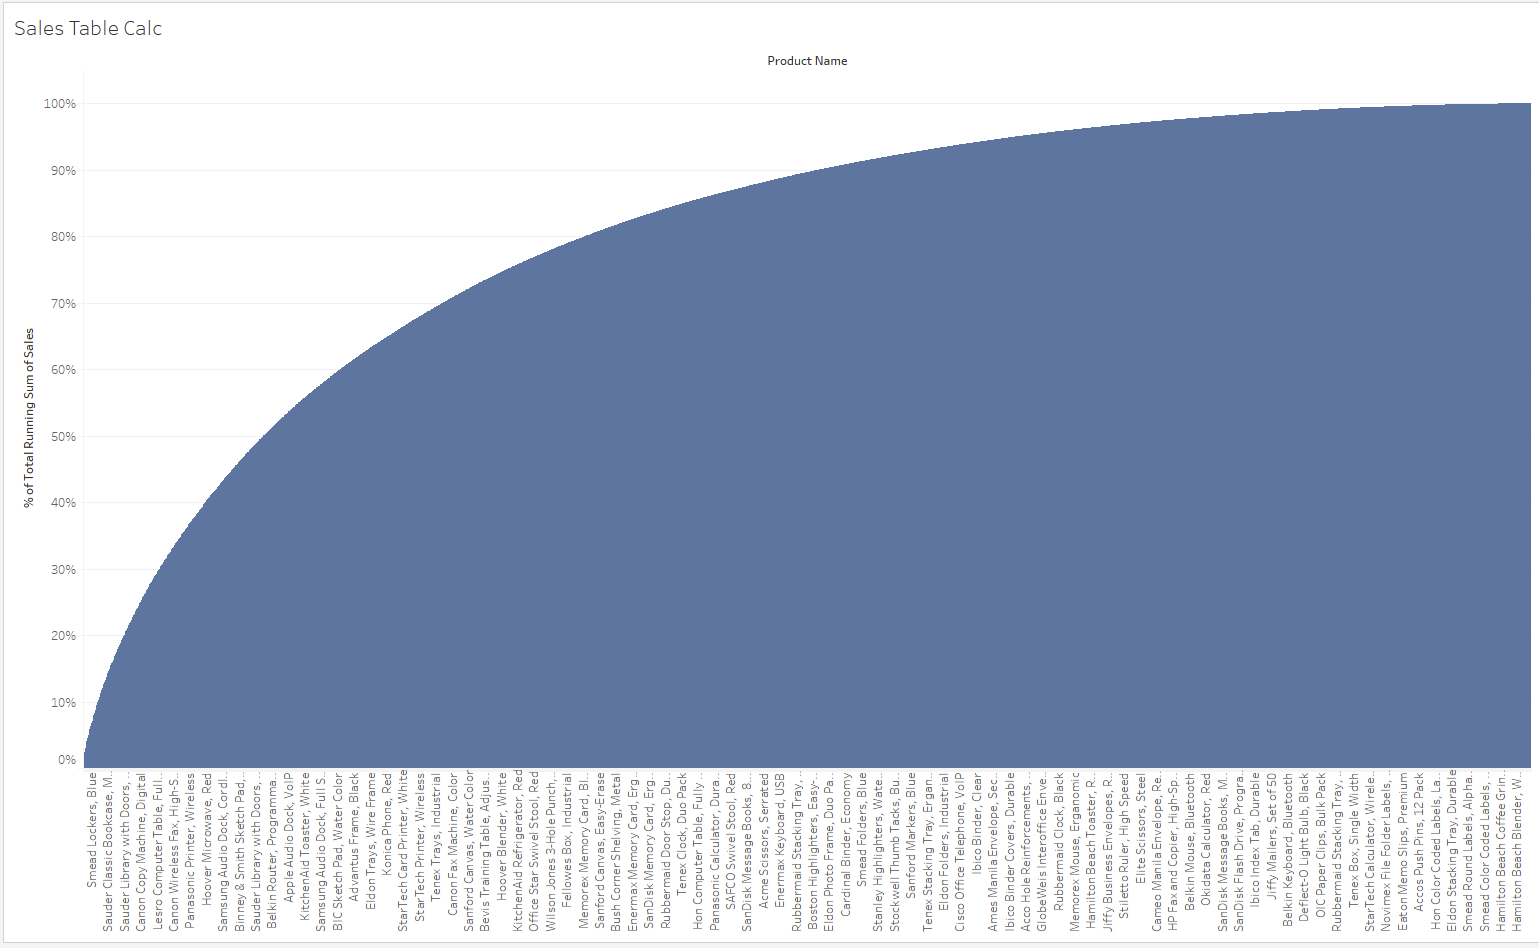
First we need to get the right measures and dimensions onto the correct shelves. If we read the above axis we know we are going to need a calculation based on Product Name and Sales so moving those into our view returns:
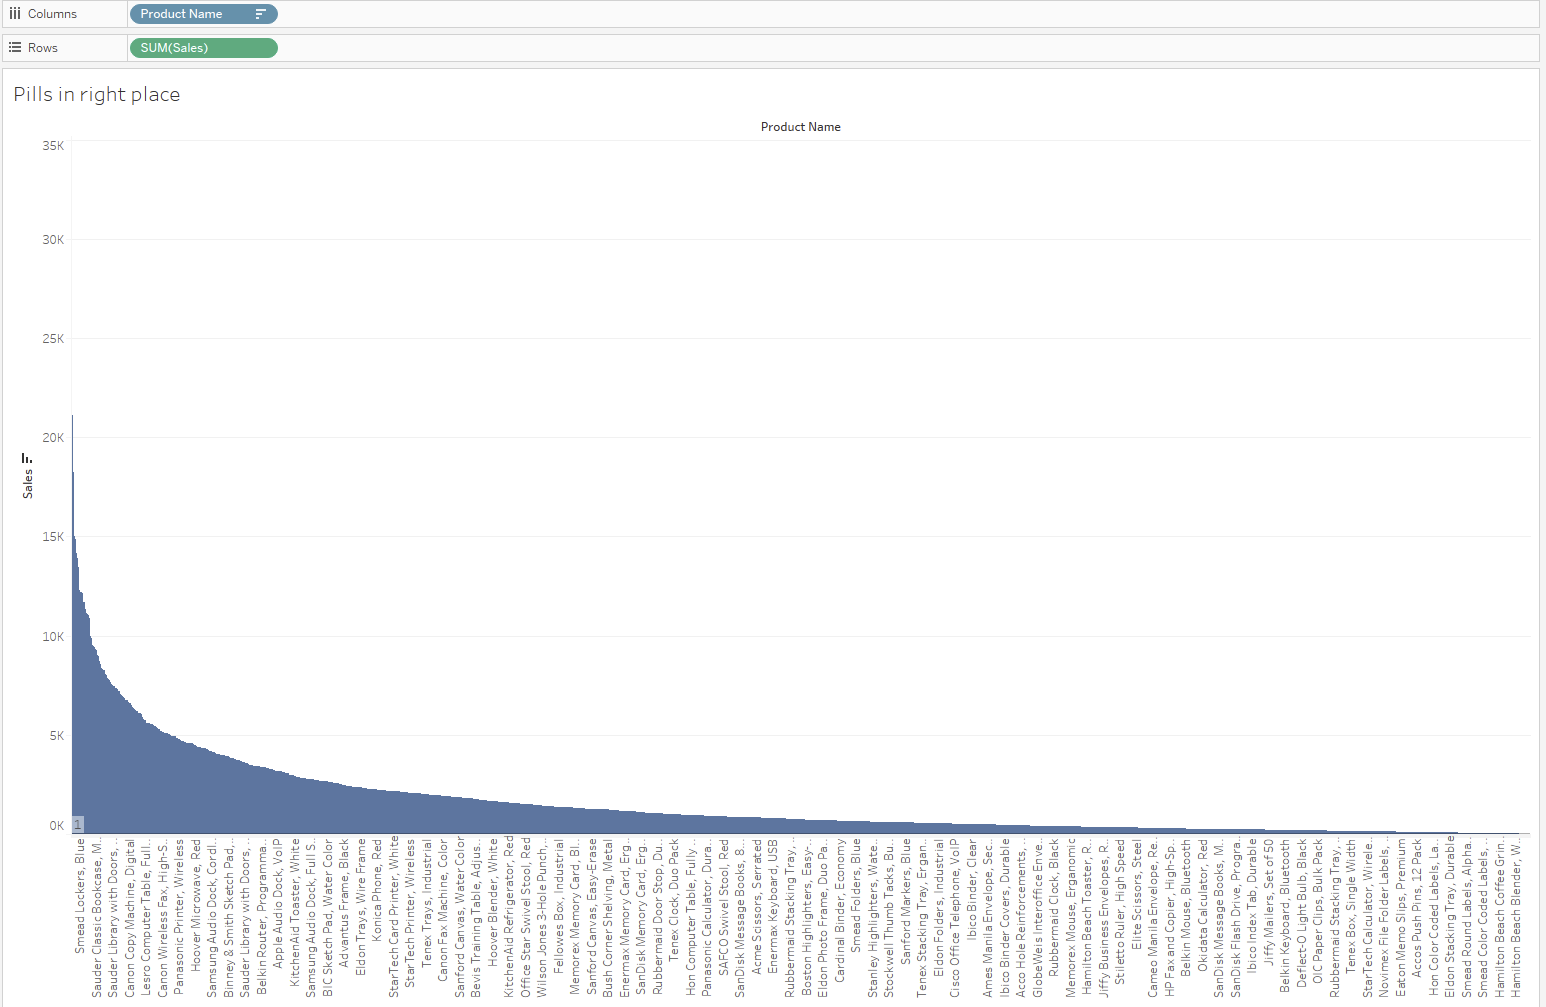
I have sorted in descending order of sales so the best selling product first. This is relevant for subsequent steps.
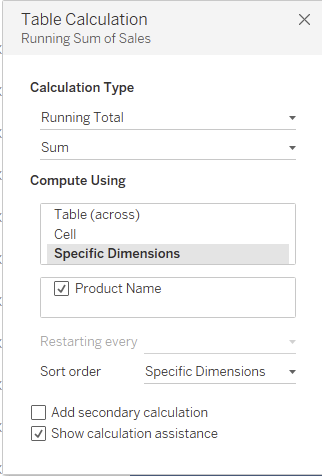
Next lets work on getting the y-axis how it needs to be in the final product. To get % of total running sales sum we are going to need to use table calculations. First a running sum:
Now we need to turn it into a % of total with the ADD SECONDARY CALCULATION option:
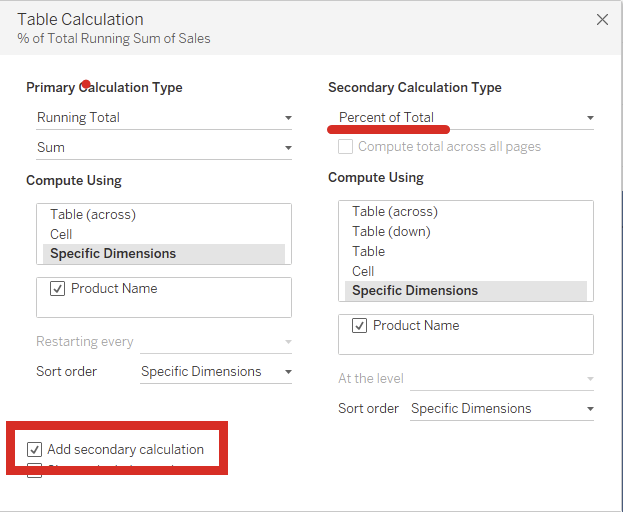
This opens up a secondary pane where we want to use the % of Total on our running total calculation. This returns:
Now we need to work on our x axis. At present we have column headers rather than an axis so we know we are going to have to change to a measure - count distinct. But for the purpose of the chart we do not want to lose the detail of what product is contributing what.
Therefore we start by shifting the product name to the detail option of the marks shelf:
Notice I have lost my sort on product name - I am going to have to add that back in then add the table calculation to my count distinct of product name:
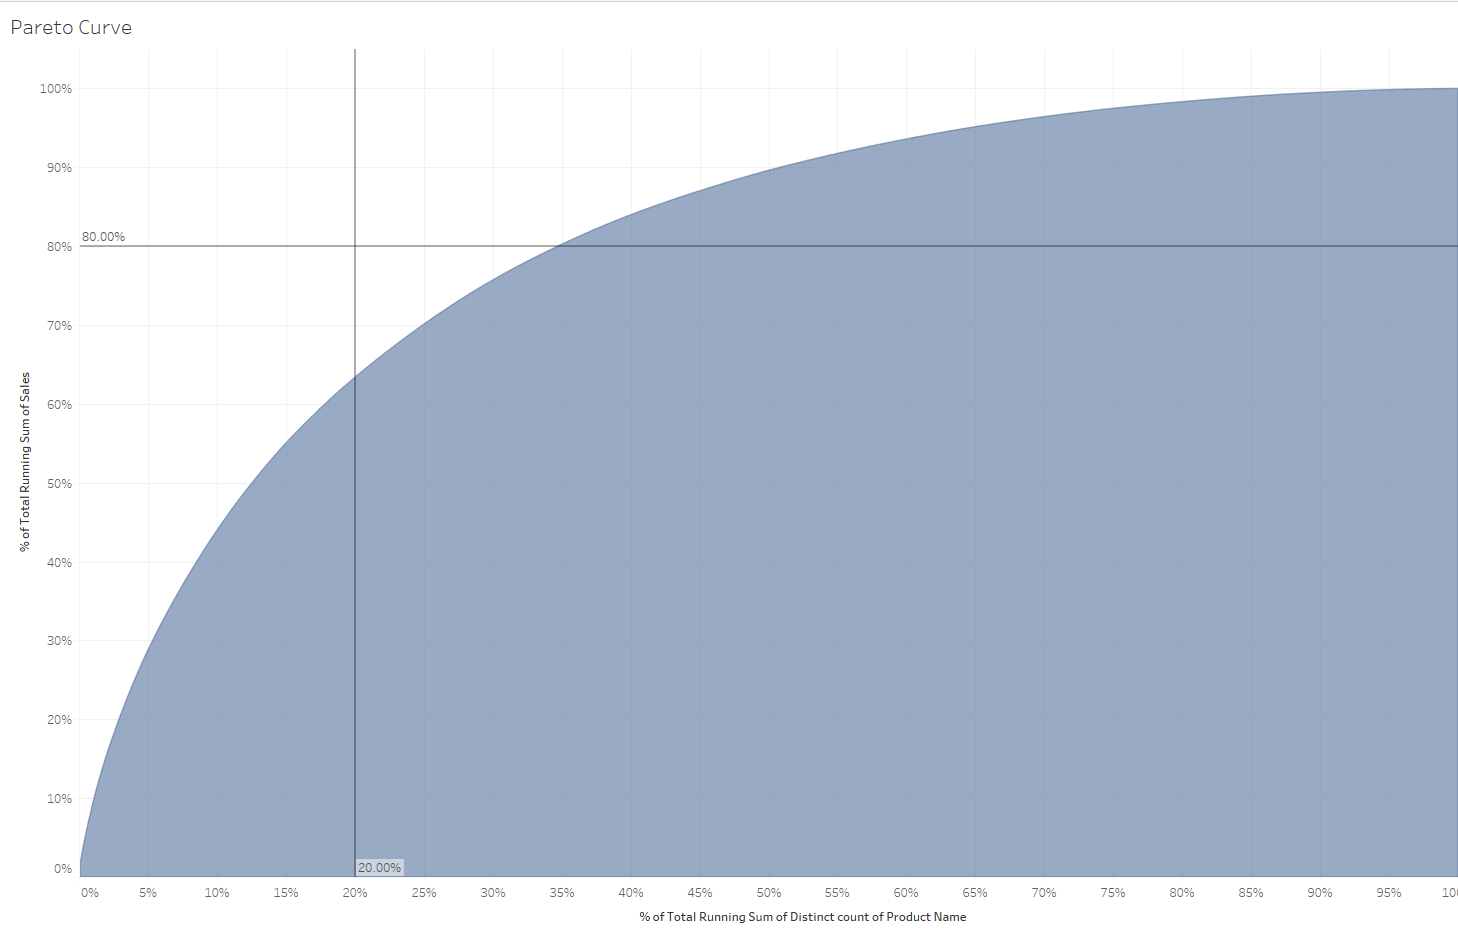
Now we just have formatting left; we can change the mark type to area and add some reference lines at 0.2 for product (20% of cause) and 0.8 for sales (80% of outcome).
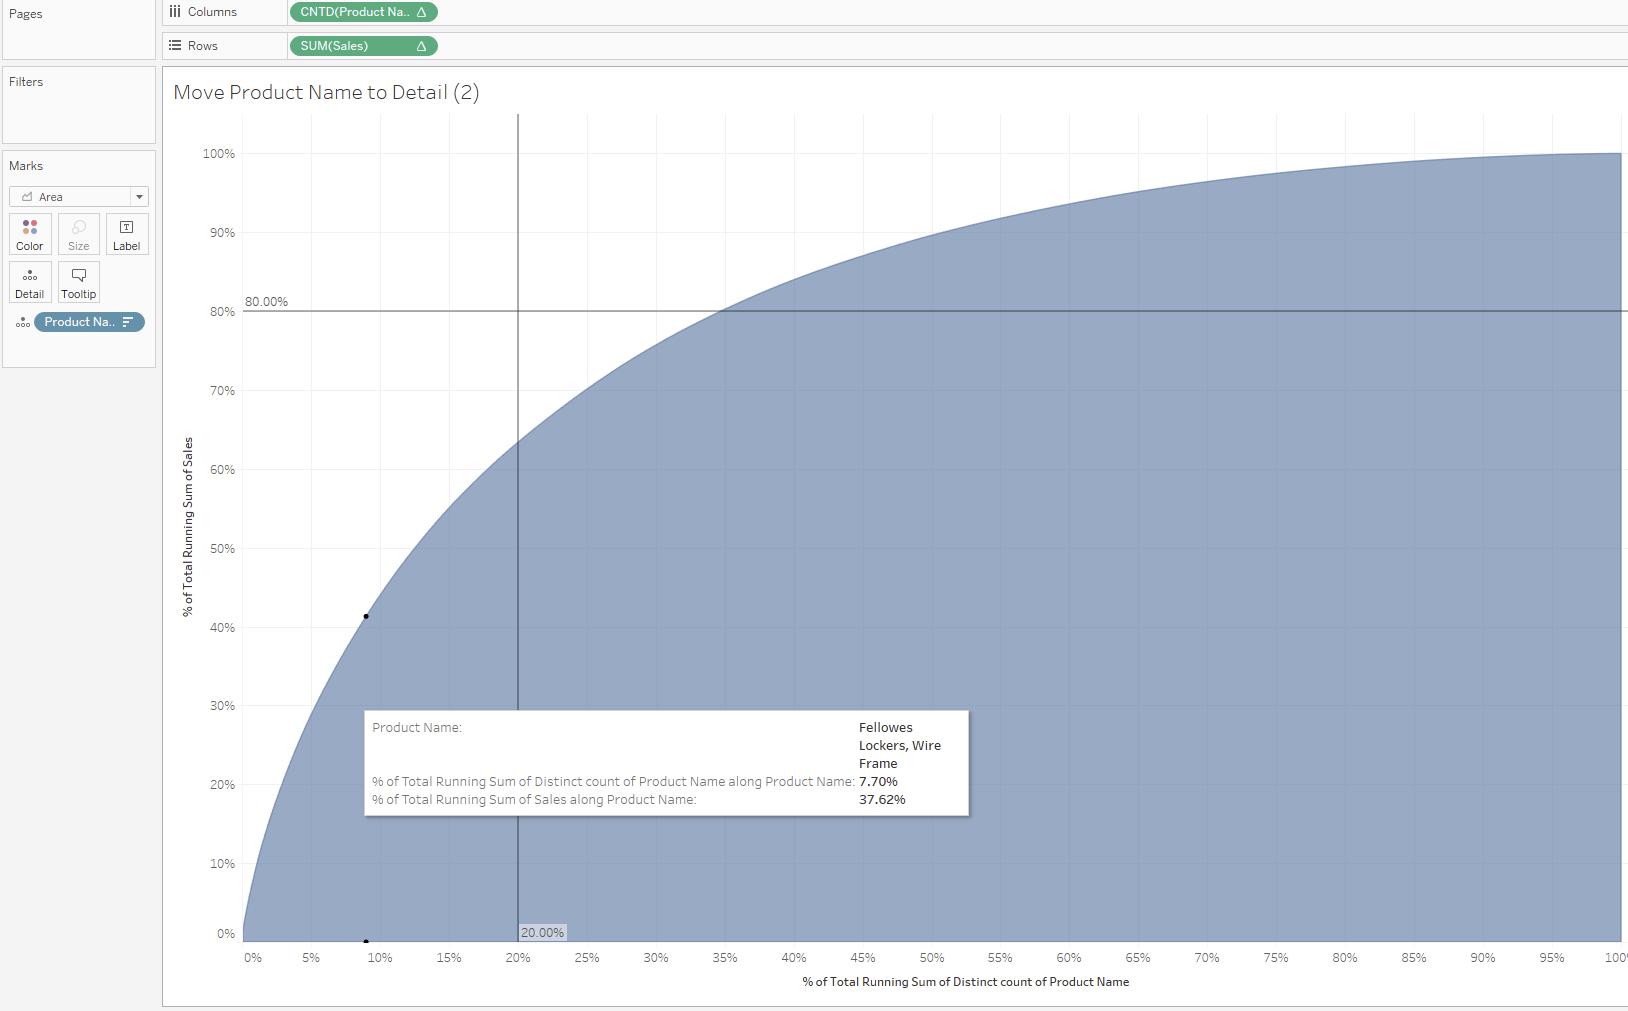
We can then read the chart as follows: the top 7.7% of products account for 37.62% of sales (from the tooltip in this instance).