Hexbins are a great way to visualise incredibly dense data without creating too many marks in the view. Here's a guide on how to create and map them in Tableau.
Step 1: Create a parameter
In order for you to choose the best density for your hexbins, it is best to create a parameter that allows you or the user to choose the number of hexbins displayed on your map. Right-click on some white space in your data pane and select create a parameter, name your parameter and save it as a float like so:

Step 2: Create your coordinates
To do this create 2 calculated fields using both the HEXBINX and HEXBINY functions as well as your coordinates and your parameter, your calculated fields should have the following inputs:
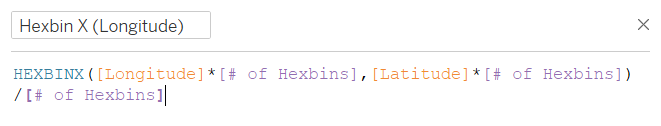
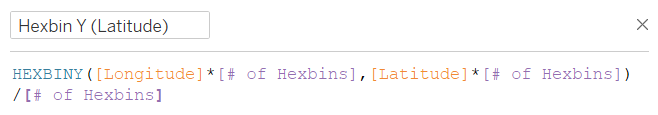
Once the calculated fields have been created, convert them from measures to dimensions by dragging them from the measure values part of the data pane to the measure names. Next right-click on the measures and change their geographic roles to longitude and latitude.
Step 3: Build your map
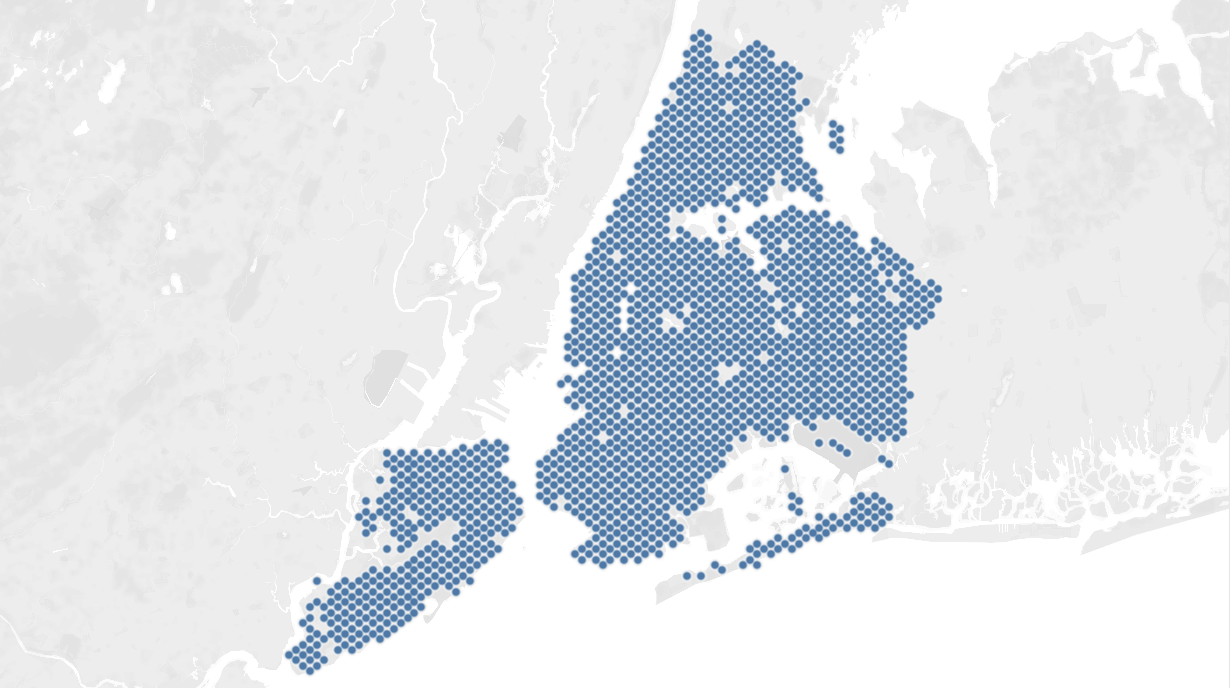
Double click your coordinates to map them. Now right click your parameter and select 'show parameter' so that you can choose the desired number of hexbins to map. In the example below I have set the parameter to 250 creating the following map:
Step 4 (optional): Customise your map
Tableau doesn't have hexagons in it's shape options, so if you want to build a true hexbin map you will need to download an image of a hexagon and save it in the shape folder in your Tableau repository (I wrote a blog on adding custom shape files to Tableau here).
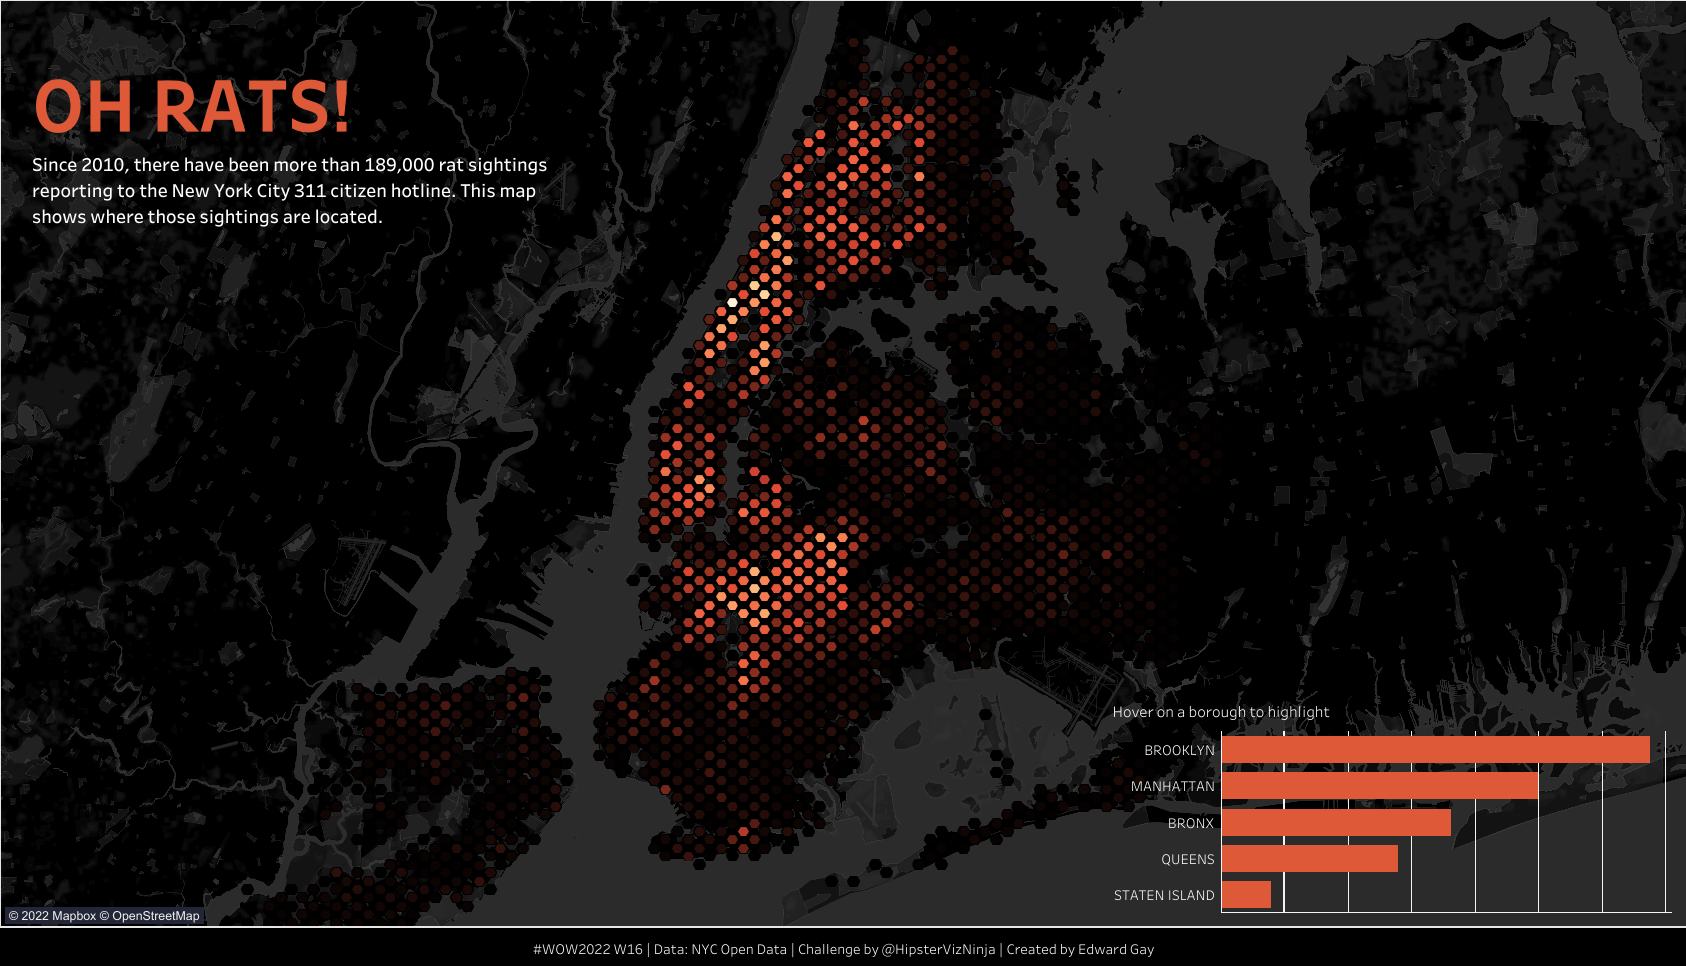
Add a metric of your choosing to colour to display it's density and your map is complete! Here is what I created for Workout Wednesday in Tableau public using this method: