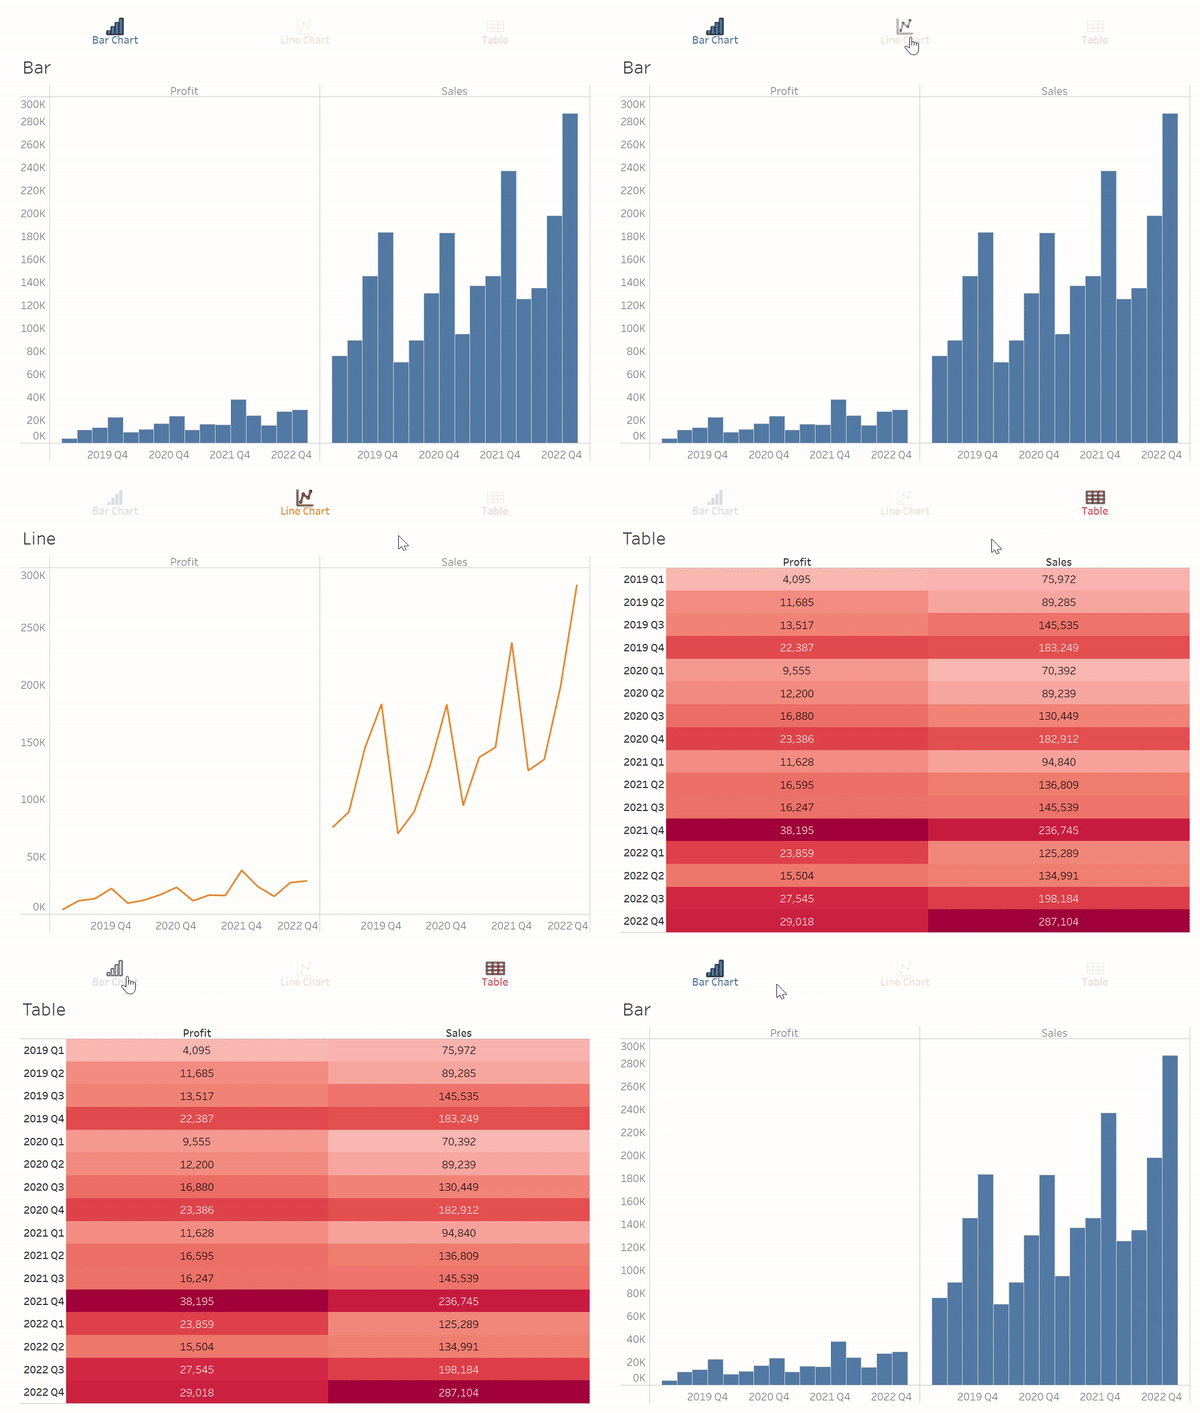
A couple of months ago I wrote a blog on How to create a chart selector using Dynamic Zone Visibility in Tableau. In this blog I will show you how you can do this with custom buttons.
Step 1. Create the Buttons
To do this, open an Excel spreadsheet, create a column with first row titled 'labels' and the rows below it titled after your button names. Copy and paste this column into a new sheet on Tableau, then format them as you please.
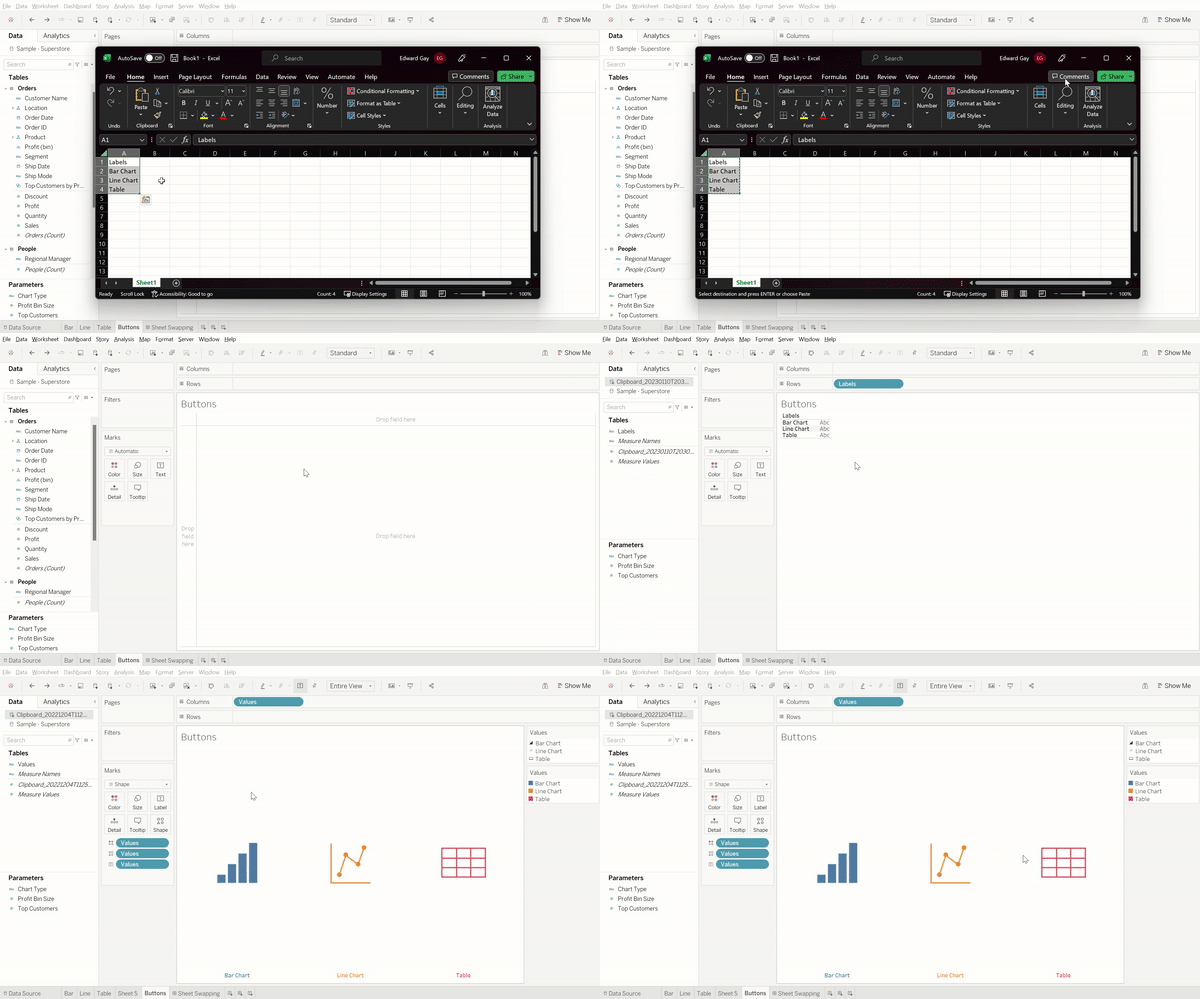
In the example above, I used custom shape files for my buttons. If you would like to add your own custom button I wrote a blog on adding custom shapes to Tableau which you can find here.
Step 2. Create Parameter and Calculated Fields
The parameter you want to make will be a list strings named after your charts like so:
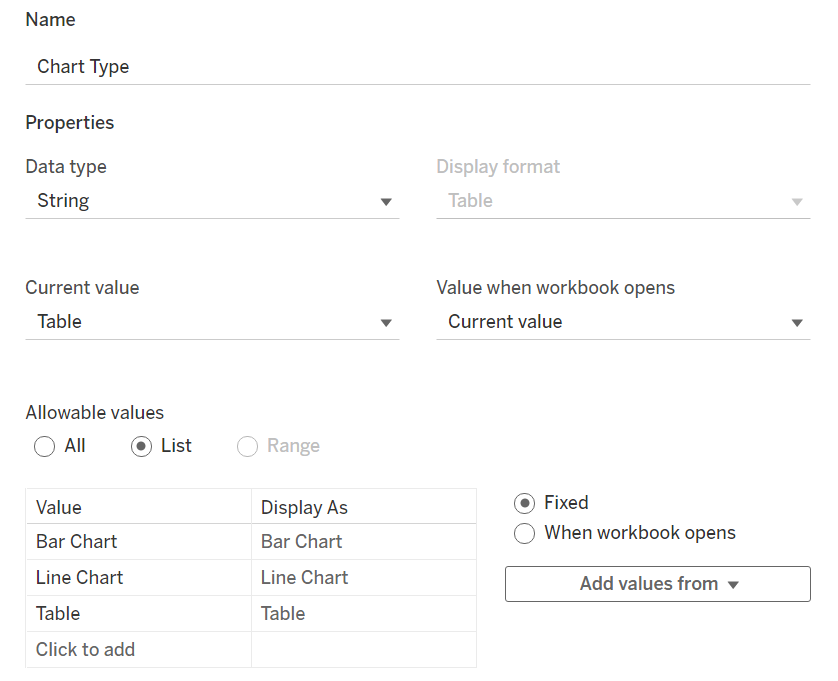
For the calculated fields you will need to create a Boolean for each button, for example:

Step 3. Control Visibility of Charts Using Calculated Fields
To do this, place all of your charts into a vertical container on a dashboard, head to the layout pane on the left and for each chart select "control visibility using value" and choose its corresponding Boolean calculation as I've done below:
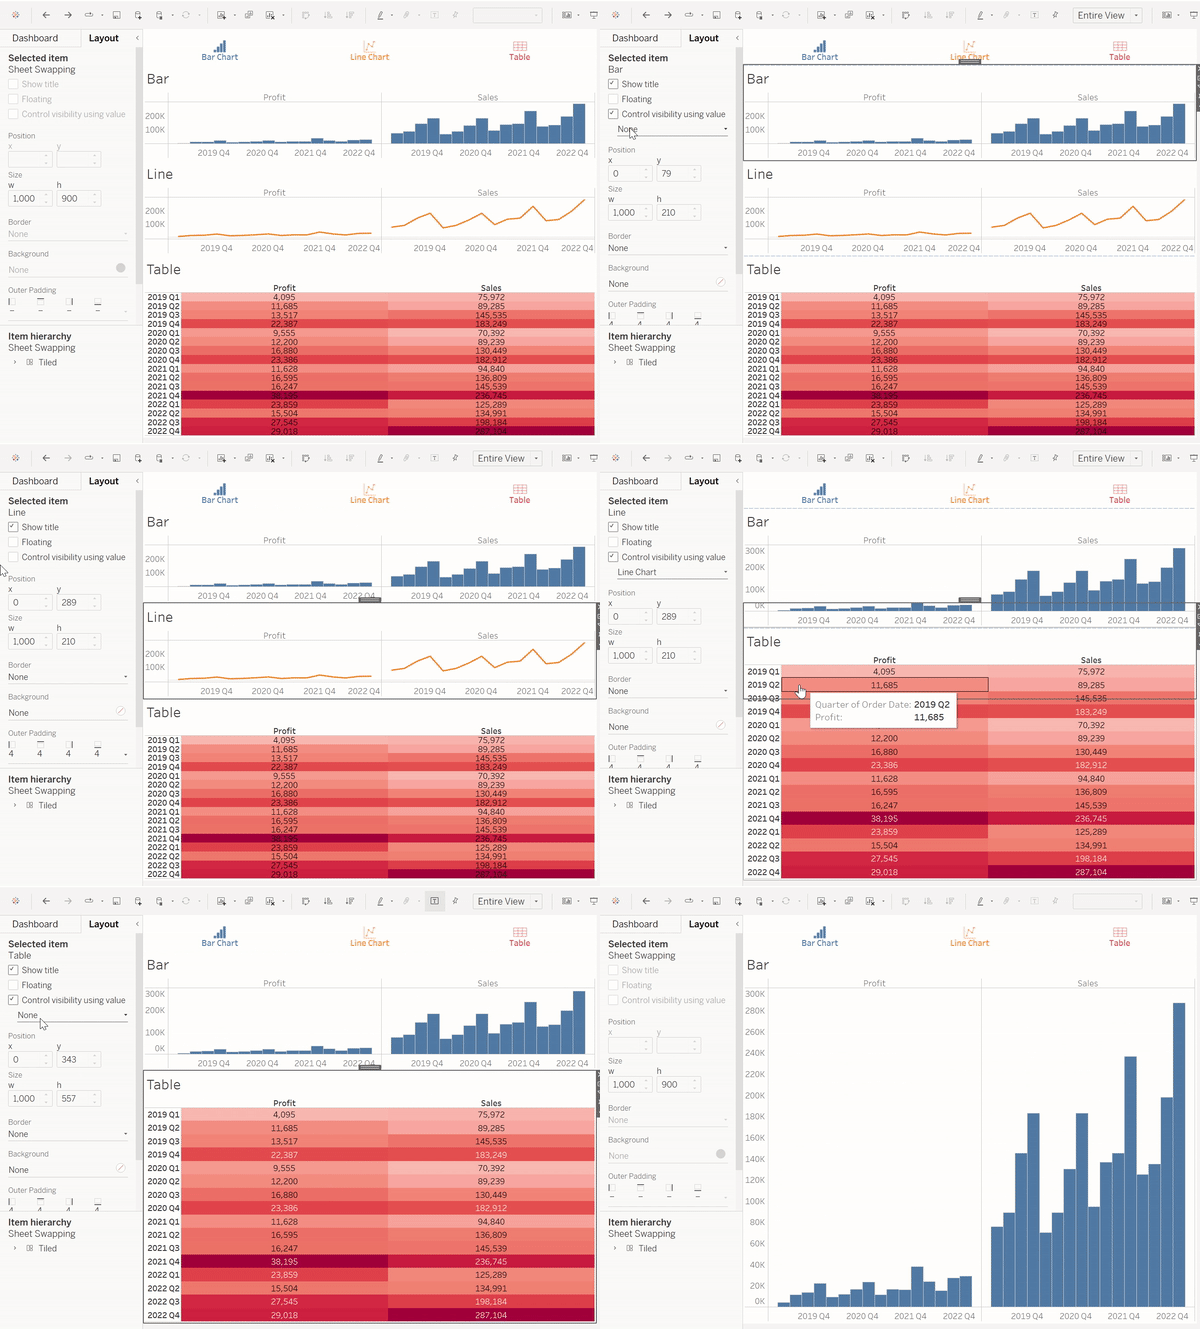
Step 4: Create a Parameter Action in your Dashboard
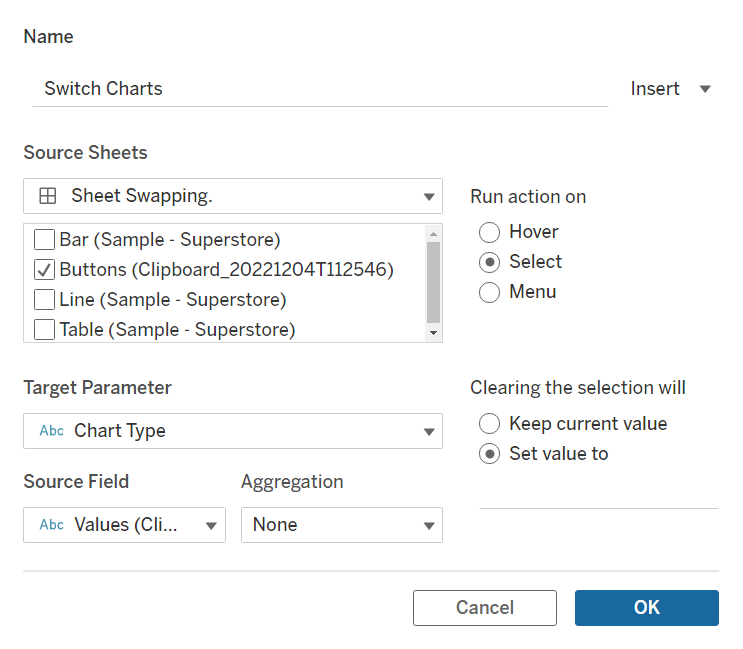
In this final step, select dashboard at the top of the window and select actions. Now you'll want to create a parameter action; where your buttons are the source sheet, your target parameter is the one made in step 2 and your source field is the values you got from Excel. The configuration should look something like this:
Now you're finished, the final dashboard should work something like this:
