


A couple of weeks ago I wrote a blog on using parameters to make a chart selector in Tableau. Here's a guide on how to create a chart selector using Dynamic Zone Visibility, new to Tableau 2022.3.
Step 1: Create a parameter
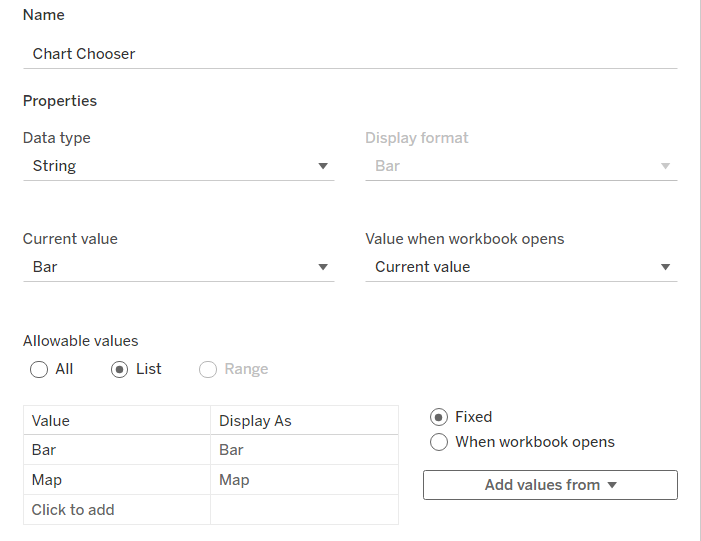
This parameter will be your sheet selector, so you'll want to create a list of sheet names to choose from. To set this up use the data type 'string', set allowable values to 'list' and type in the name of each chart type you wish to include.
Step 2: Created calculated fields
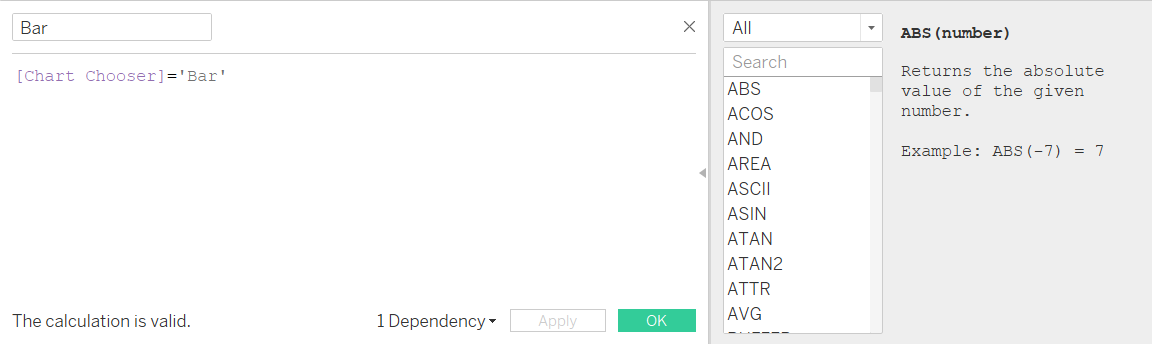
Now you'll want to create calculated fields for each chart. In these fields you'll be setting your parameter equal to the chart names that you set up in your parameter like so:
Step 3: Build your dashboard
Drag a vertical container into the dashboard, then drag the sheets you want to switch between into the container.
Step 4: Assign parameter options to charts
To do this select one of the charts in your dashboard and go to the layout pane on the left. Select the 'control visibility using value' option, choose your data set and select the parameter option. For example, I have selected my bar chart so I chose the 'Bar' option.
Repeat this step for all the charts you want to switch between in your dashboard. If everything is set up correctly your dashboard should work like this:
You should now have a dashboard with a working chart chooser. One advantage of using dynamic zone visibility over the previous method is we now get to keep colour legends and chart titles. Dynamic zone visibility is capable of much more than creating chart selectors, stay tuned for more use cases!