In preparation for our Alteryx designer core test on Friday, DS35 have been working through Alteryx challenges. Here is a walkthrough of one of those challenges.
In this example, the data represents quarterly sales for each product. We need to restructure the data so it is one record per product per quarter per year with the data fields - Sales, Avg Sales, GM and Performance.
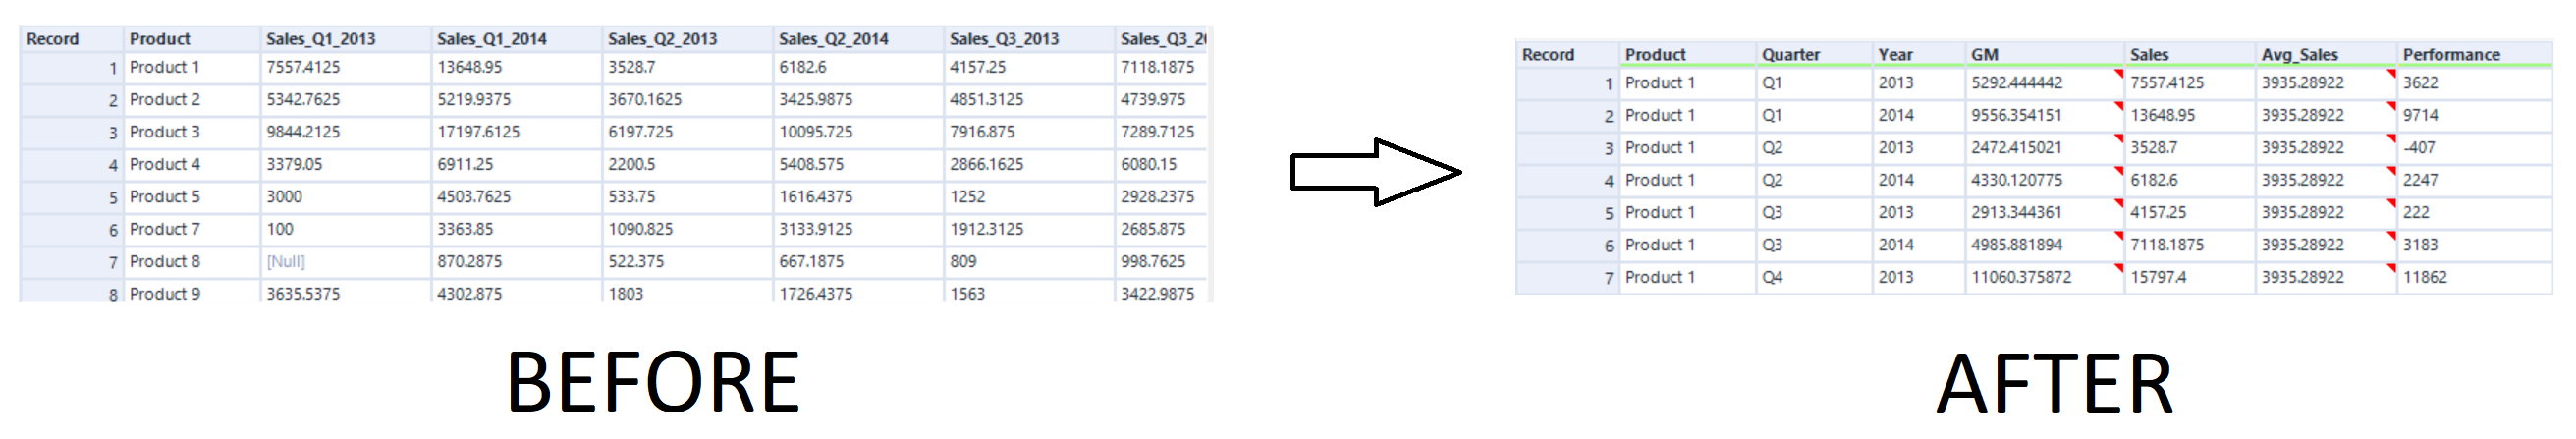
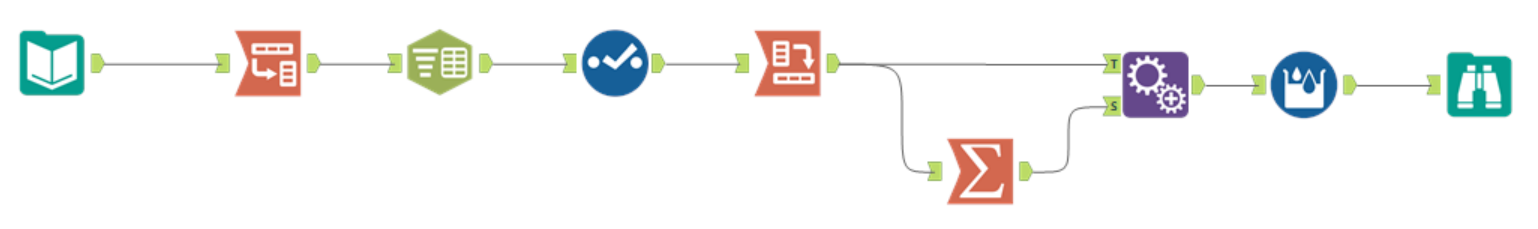
To start, I pivot the sales and GM columns using the transpose tool so that they all fit into one column. Next I use the text to columns tool to split Sales_Quarter_Year into Sales, Quarter and Year.
Using the select tool I remove the old Sales_Quarter_Column and unpivot the table using the cross tab tool so that Sales, Quarter and Year all have their own columns.
Now that the data has been restructured, I use the summarise tool to calculate average sales, then add average sales to the rest of my data using the append tool.
Finally, to calculate performance I used a multi-row formula tool with the expression [Sales]-[Avg_Sales]. Add a browse tool and the workflow is complete.