This Workout Wednesday requires a good knowledge of LODs, parameter actions and viz in tooltips. My approach below walks through how to create the initial bar chart and breaks down the logic behind the LODs that are needed – it may seem straightforward at first but actually requires a bit more thought.
You can try the full challenge yourself here!
Ultimately, we are trying to find the most popular sub-category by sales per state, with the final bar chart set to show the number of states where each sub-category is the top seller. To do this, we need to break it down into three steps:
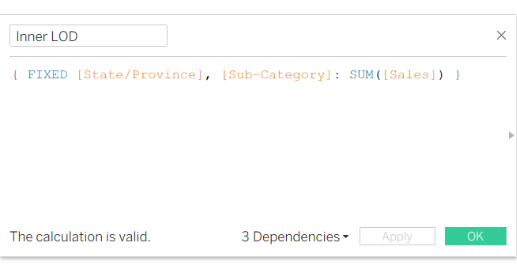
1. Inner LOD: for every state and sub-category, what is the sum of sales?
This can be answered with a LOD calculation fixed on state and sub-category:
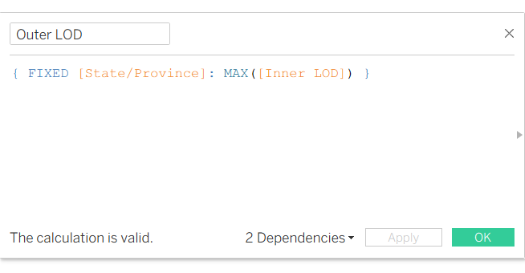
2. Outer LOD: for every state, what is the maximum sales achieved by a sub-category?
This is simply finding the maximum of the previous LOD, for every state:
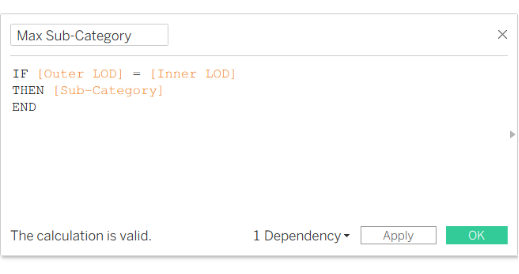
3. Max Sub-Category: which sub-category has the highest sales per state?
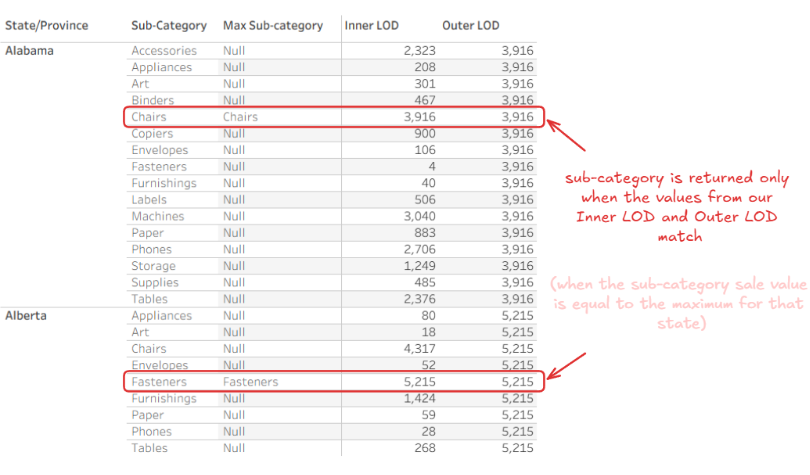
For every state and sub-category, we will be asking if that sub-category is the one that achieved the maximum sales in its state, i.e. does our Outer LOD equal our Inner LOD?
If it does, we want the sub-category name:
To check our calculations so far, we can build a simple text table:
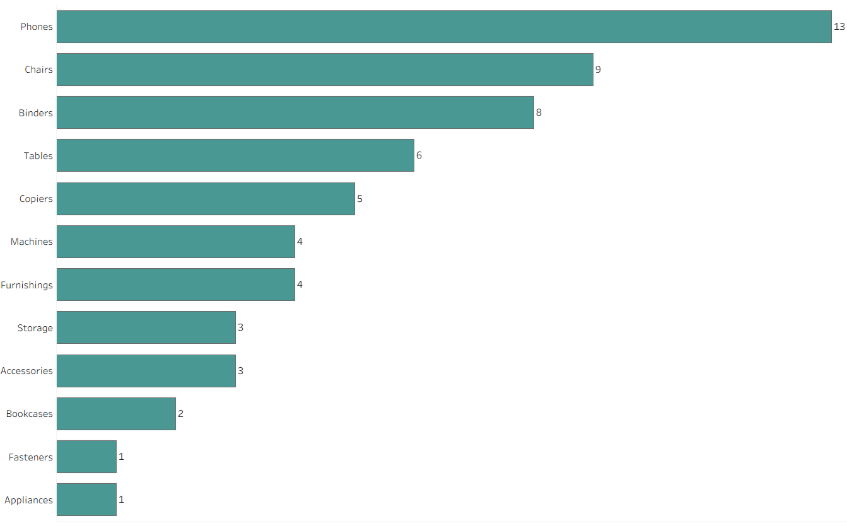
Now, to create the final bar chart that shows the number of states where each sub-category ranks highest by total sales, we put our ‘Max Sub-Category' calculated field on rows and State/Province on columns using count distinct.
Excluding the null values and sorting in descending order tells us that that phones was the most popular sub-category by sales in the most amount of states (13).