


Although we want a dashboard to be as informative as possible, overcrowding them with multiple charts and metrics on display is not always the best approach. This can have the opposite effect of what was intended - instead of helping the user navigate and interpret the data effectively, it can overwhelm them and obscure the most important insights.
One way to navigate this common pitfall is through the use of a parameter. This gives the user control to choose what metric they would like in the view, reducing visual clutter.
When working with parameters, it’s important to remember that each parameter requires a calculated field that references it, in order to apply the parameter to the relevant chart. With this in mind, let’s move onto the example!
In this example, we want to be able to switch between the sales, profit and quantity for each product sub-category.
1. Setting up the Parameter
When we create a parameter, a pop-up window appears where we can define its settings. We will set the data type to string as the parameter will be used to switch between different measure names (which are strings). For allowable values, we choose list, because we will be providing predetermined values for the user to choose between. We can then type in the predetermined values – in our case: sales, profit, and quantity. Be mindful of how these values are formatted (capitalisation/trailing spaces etc.) as the calculated field to come relies on an exact match.
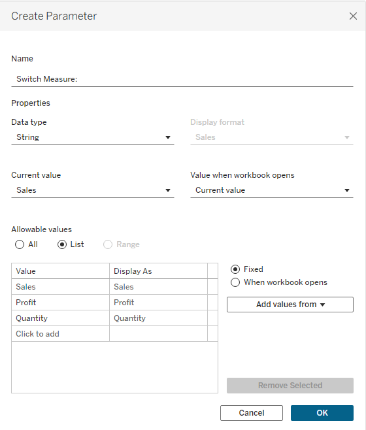
After clicking OK, go ahead and show the parameter that’s just been created so that we have it in the view.
2. Setting up the Calculated Field
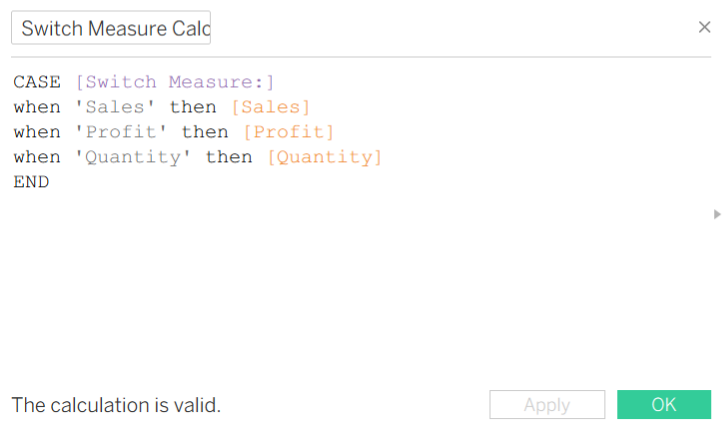
Here, we use a CASE function that references the parameter we have just created, and maps each parameter value (make sure to type it in exactly as you did in the parameter!) to its corresponding measure in the dataset. This allows the selected parameter value to dynamically control which measure is displayed in the chart.
Since we want to switch between measures for each sub-category, we place the calculated field on columns and sub-category on rows. Now the measure selected through the parameter is what will appear on the x-axis.
The same steps can be applied to switch between different dimensions too.