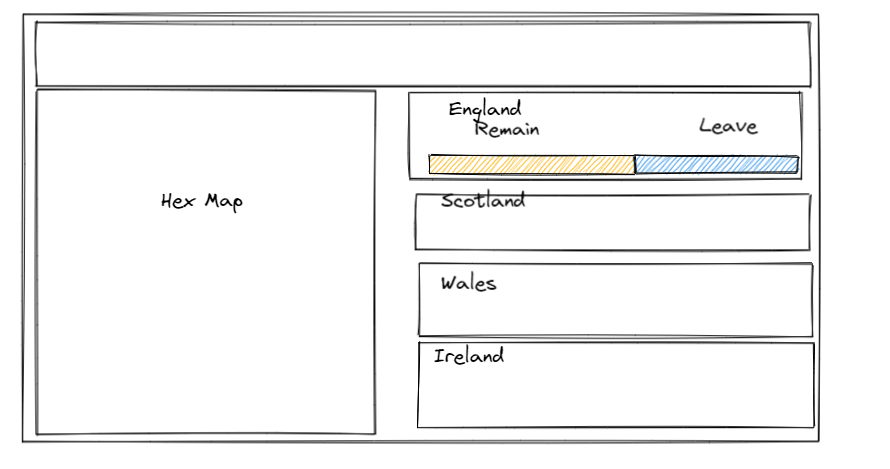
Today was the last day of the dashboard week and the topic today was the Brexit voting results.
We were tasked to focus on design and create a KPI/ Overview dashboard.
I wanted to use a hex map as I hadn't used one before and had feedback from the previous day so that was my goal and planned around that.

I struggled to get the hex map to work and because this was only a couple hours take that ate into my time a fair amount and I should have rethought my design when I found I was struggling.

