


I would say that my journey to the Data School (as a career changer from teaching and performing music) was unusual, except everyone here seems to have a different background! Still, mine had its ups and downs, so I thought it was worth sharing. I hope it might help someone else who finds themselves in a similar position to the one I was in.
Having graduated with a degree in Geography from the University of Bristol back in 2018, I did have some experience in statistical analysis related to social science and research projects. I performed well in those modules! However, it wasn’t a data science degree, and although I enjoyed the analytical content, I wasn’t fully immersed in it.
Upon graduation, like many others, I didn’t have a clear direction. I supposedly had a broad, sellable degree, but an incredibly dull, un-air-conditioned summer internship (in the sweltering summer of 2018) squashed any immediate desire to dive into 9-to-5 office work!
This led me to take a bar job, where I discovered a great enjoyment in the community and social aspects of the work. I rose to the management team and even moved into the room above the pub—just in time for a certain pandemic to hit. Not ideal, but being in a private pub during a lockdown wasn't the worst place to be in the world! Throughout my time in hospitality, I had also been building up a business around a great passion of mine: jazz guitar. I had played all my life and steadily developed a teaching client base along with performance work. When the pandemic passed, I jumped into this work more earnestly and spent the next two years as a freelance musician.
This was an exciting time for me, but I also began to feel slightly detached from the “real world.” Despite the perks of my lifestyle, I became ready to start a new career and wanted to engage my analytical skills again. I wanted to work on projects with tangible real-world impacts, alongside driven, talented people.
One small problem: it had been a while since graduation, and I didn’t feel my CV adequately represented my talents! I am creative, analytical, friendly, and hard working, but employers would see "hospitality" and "music" on my resume and run a mile! I found it impossible to get a foot in the door for a new career. To make matters worse, I was feeling really quite picky! I didn’t just want a "job"; I wanted a career. I wanted to upskill and learn something new that I could sell myself on. Needless to say, I wasn’t having much luck—until I stumbled upon the Information Lab!
It quickly became clear to me that this was an opportunity I had to take seriously, especially as a career changer with my specific interests and requirements. The Information Lab was offering:
- A healthy starting salary (which I found to be far from the norm in my search!).
- Paid training!!! I wouldn’t have to invest in a master’s program or take evenings off work to study online courses whose value I was unsure about. This point was huge for me.
- Creative and analytical work. I believed my analytical social science background combined with my creativity would position me well for success in the role.
- A unique application process. Perhaps the most important point! I know my strengths and weaknesses, and I was confident that I could succeed in this role. But I also knew that my CV wasn’t competitive for such an obviously sought-after opportunity. Wait… they don’t care about your CV? Just your dashboard submission? Time to watch some Tableau tutorial videos and get to work!
My Application (Part 1)
To be clear, at this point, I had never heard of Tableau, let alone used it. My first dashboard took me longer than I care to admit, as I spent evenings, lunch breaks, and weekends figuring out the software—or brute forcing it to create some simple charts, depending on who you ask! Crucially, I found that I was enjoying myself, and the more I worked at it, the more I wanted to learn.
After a whole lot of grinding, and brushing off my social science cobwebs, here’s what I came up with for my first (foreshadow alert) initial application viz:
https://public.tableau.com/app/profile/dom.brady/viz/MalthusVis/Dashboard2
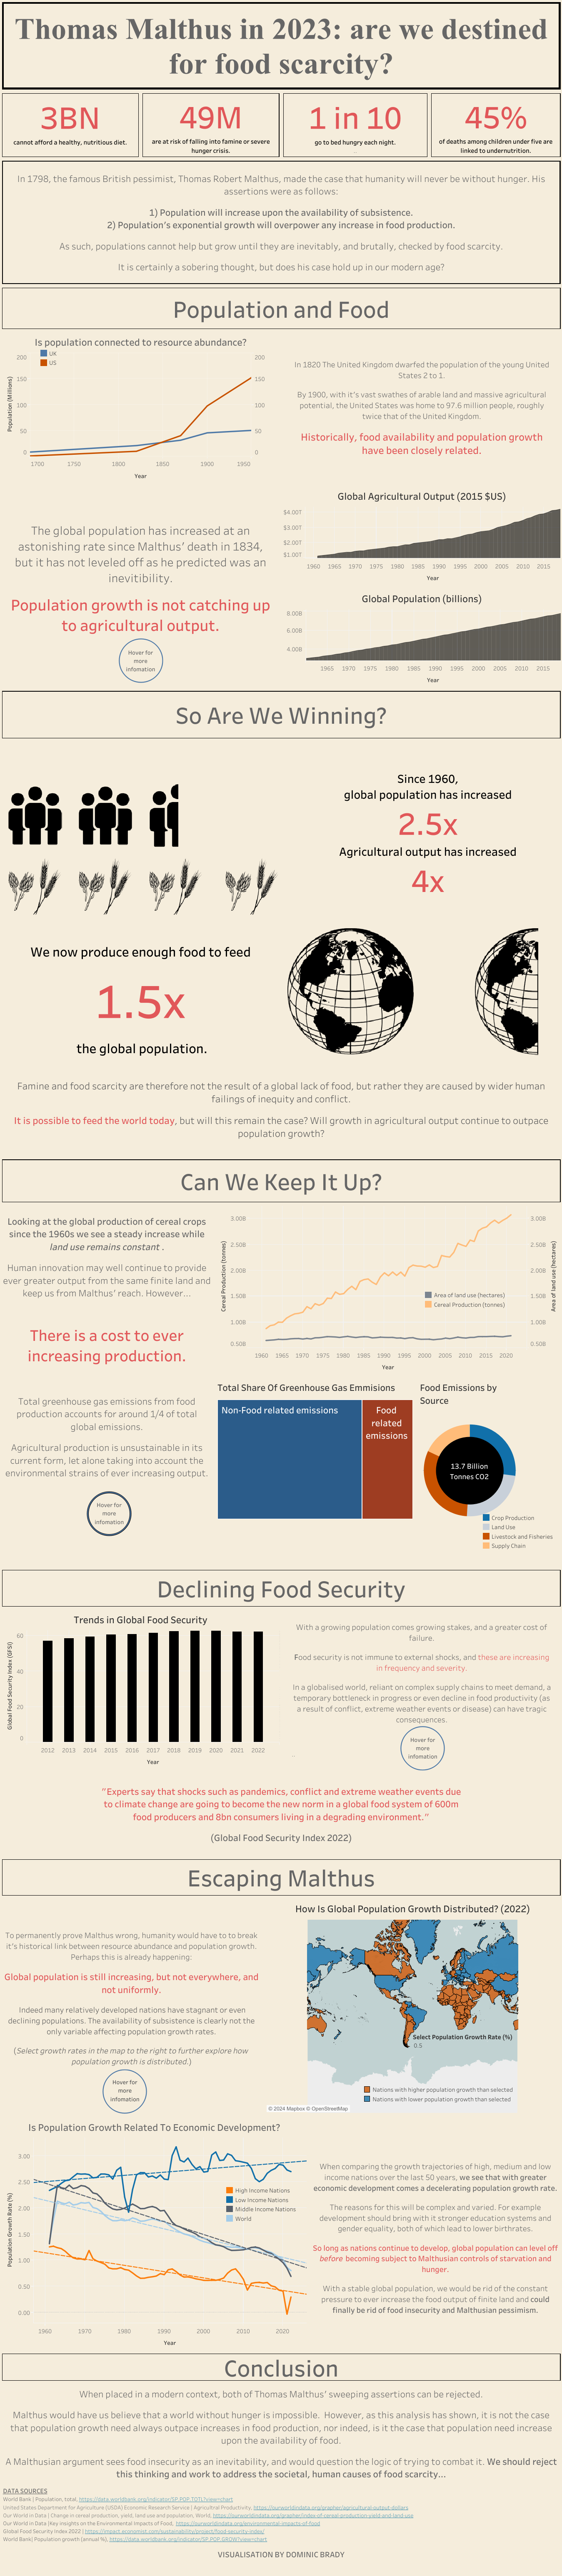
It may not have been particularly pretty and still contained too much text, but it got me through the initial screening! This experience gave me a rudimentary understanding of filters and parameter actions, but more importantly, it highlighted just how much more there was to learn. Despite that, I was genuinely enjoying myself.
Now it was time for my first (foreshadowing part 2) final interview dashboard:
https://public.tableau.com/app/profile/dom.brady/viz/FinalInterview-streamlined/Dashboard1
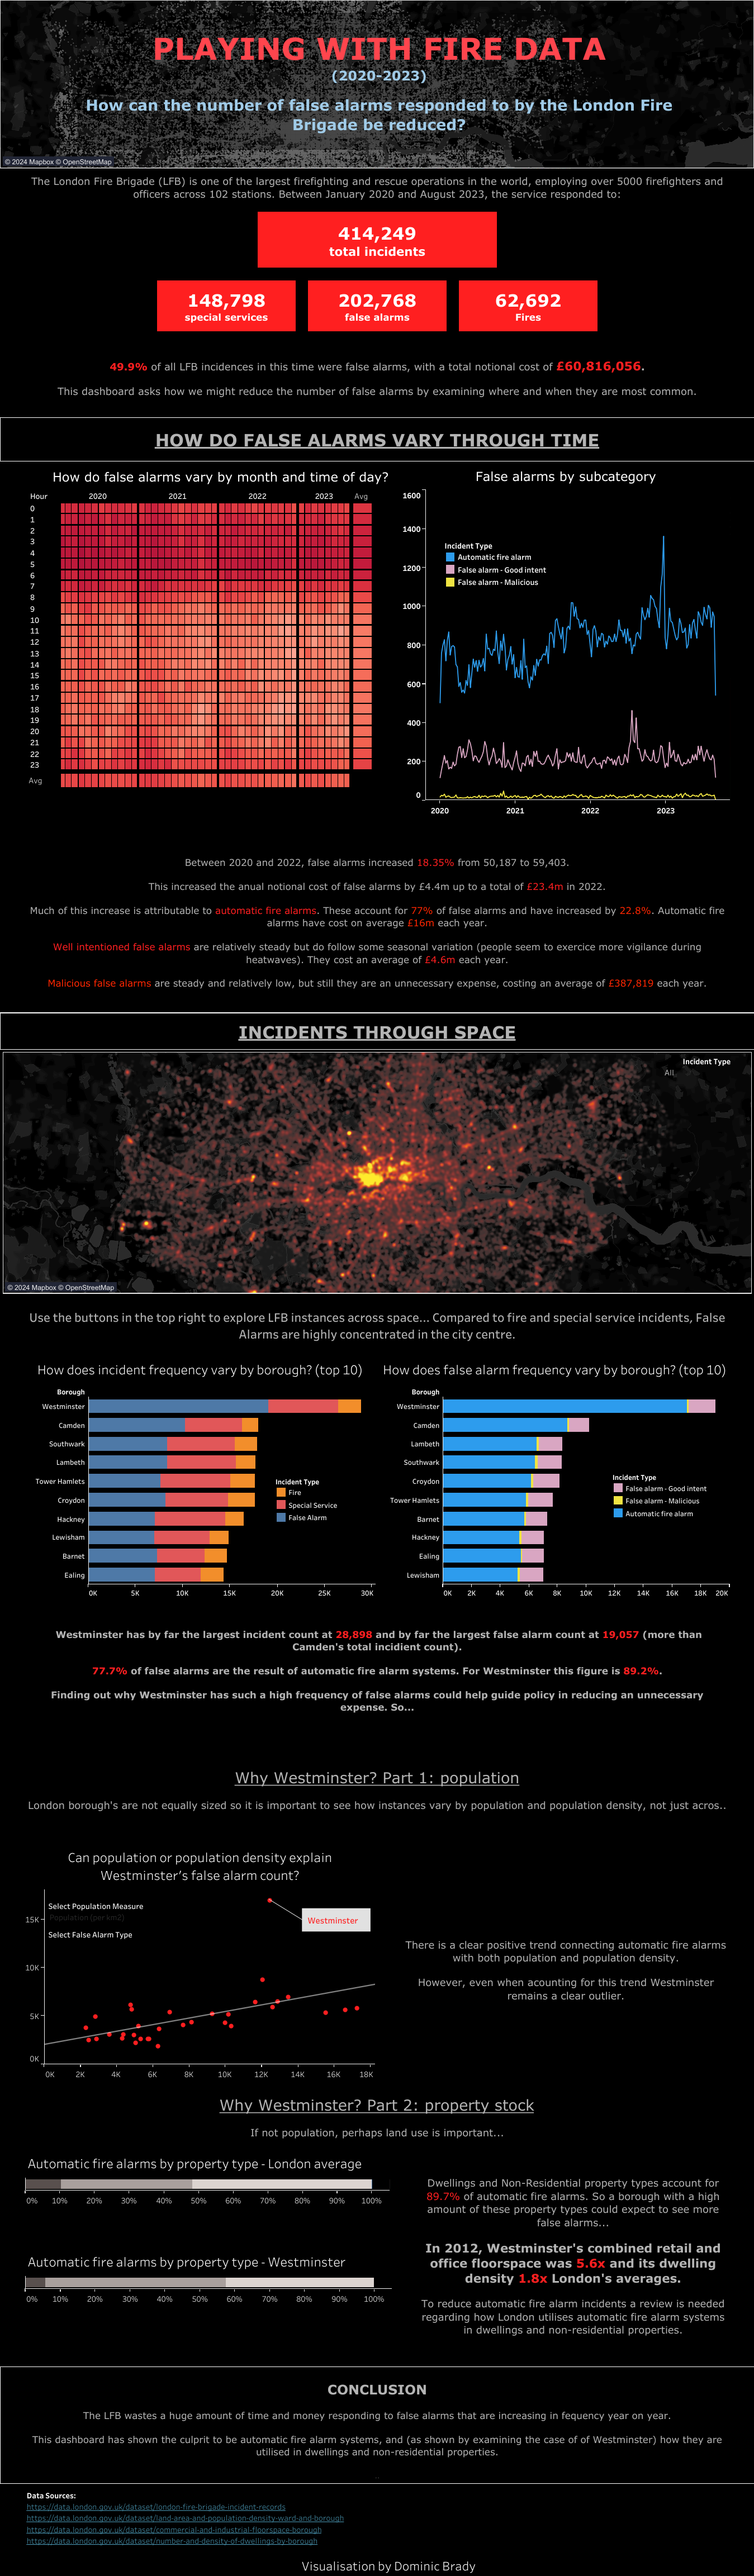
I thought I was pulling out all the stops with this one, opting for a bolder, stylised aesthetic alongside more complex charts like a heat map and a density map. I practiced the presentation and gave the final interview my best shot. Sadly, despite all my technical efforts, I had neglected the "unseen" dashboard section of the interview—where I was required to critique and recommend changes to someone else's work. Here, the pressure got to me, and I took too long to fully grasp the task, suggesting vague stylistic improvements instead of approaching it like a consultant. I should have focused on critiquing the information the dashboard presented and how it related to the overarching question. I felt lose the room and wasn’t surprised when I received the call saying I had narrowly(!) missed out on the opportunity—but that I should absolutely try again!
My Application (Part 2)
It was a massive disappointment not to have secured the role on my first attempt, especially given the amount of work I had put in. However, I recognized that this same effort would streamline the process for round two! So, I got to work on my second application viz...
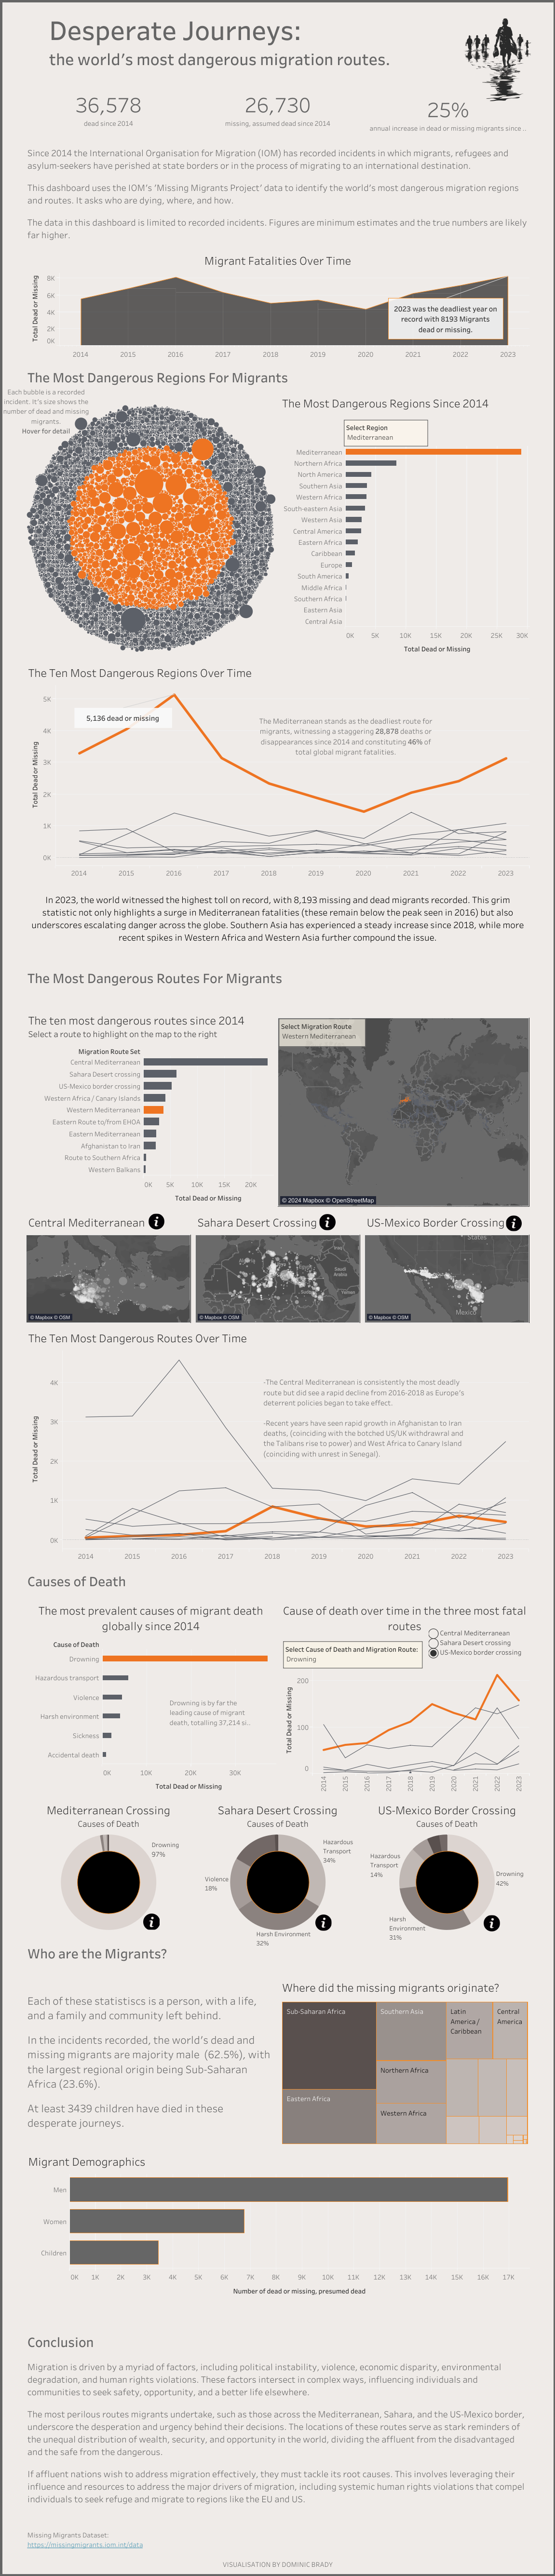
Again, I experimented with a couple of new charts, like the bubble chart of incidents, along with what I thought was some interesting mapping of dangerous migration routes. Largely, though, I tried to keep things simple—using less text and focusing on visual storytelling. Given the serious nature of the topic, I limited the color palette, using only orange for emphasis. I was proud of this one, and since it was notably better than my last attempt, I found myself back in the final stage of the application:
https://public.tableau.com/app/profile/dom.brady/viz/U_S_Emissionsdraft1/Dashboard1
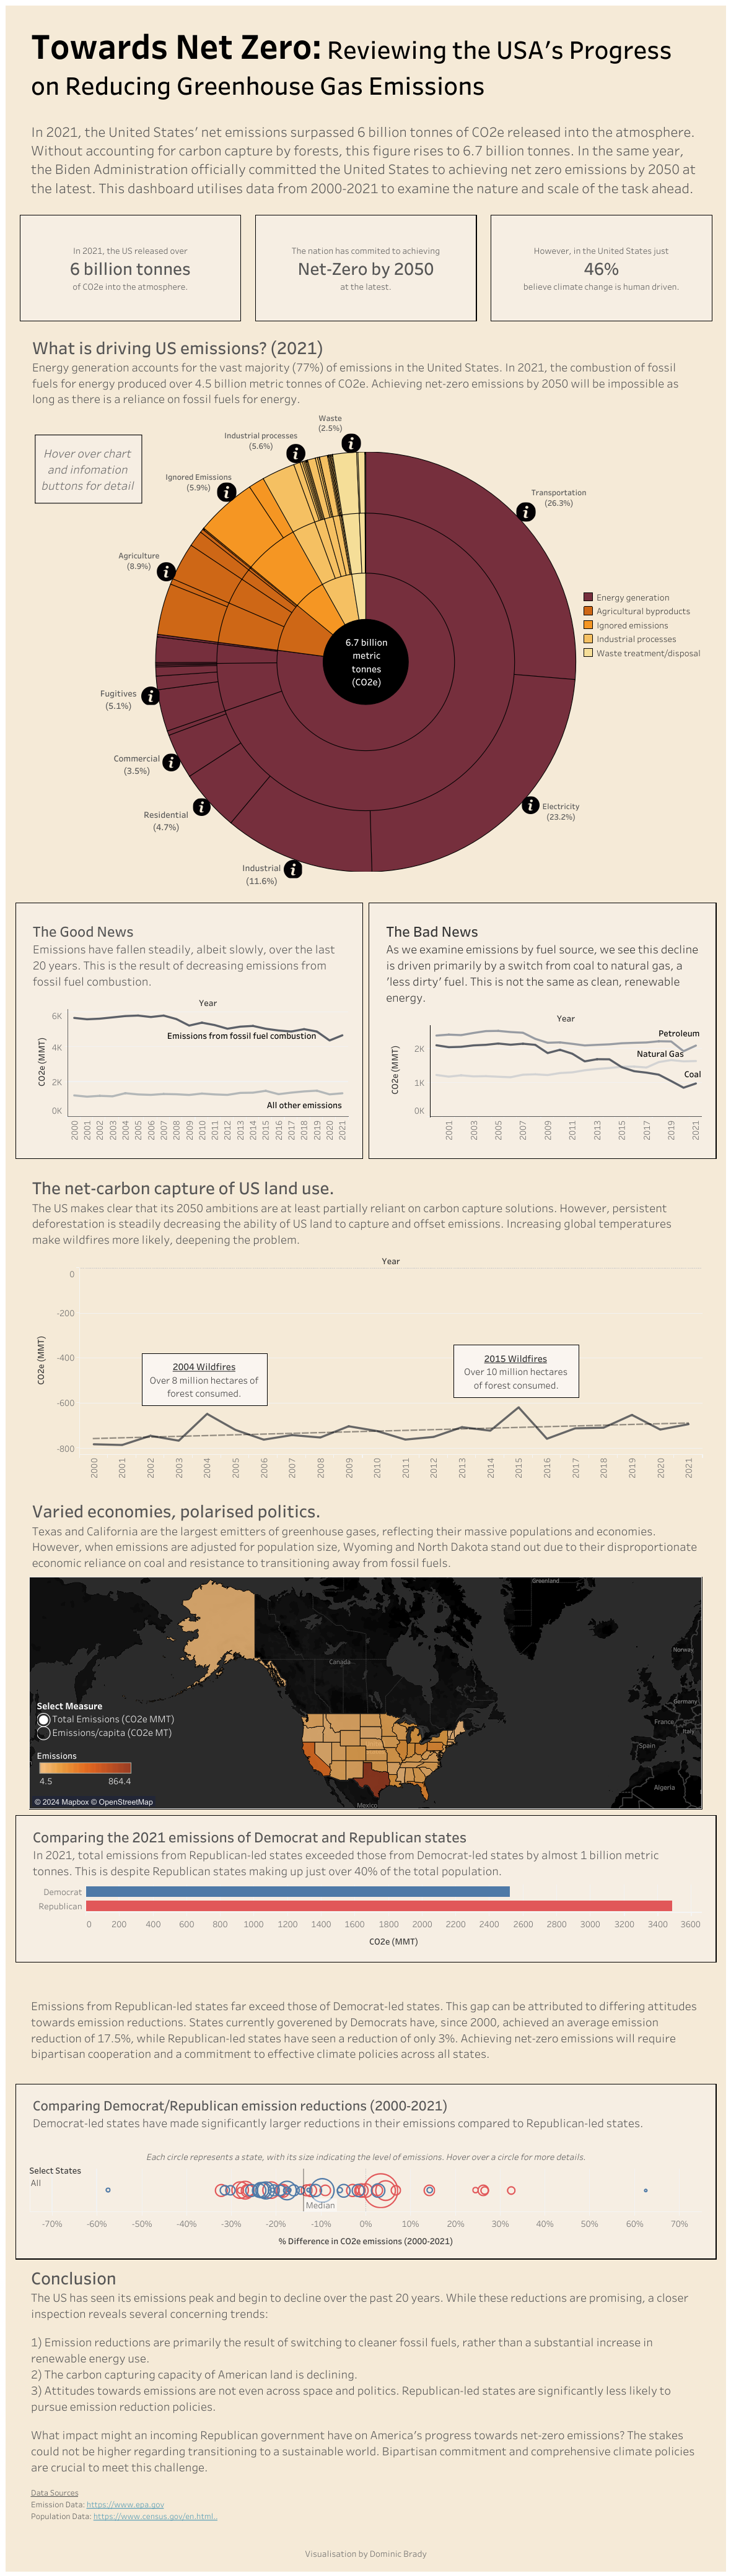
I felt pretty good about this one! I had a nice, complex sundial chart as the visual centerpiece, and the dashboard as a whole effectively told a compelling story. I was certainly more confident this time around than I had been previously. However, the pressure loomed large; I was determined not to have to motivate myself for a third attempt! Thankfully, my last experience had effectively exposed my weaknesses, so I spent a solid chunk of preparation time analyzing other visualizations and considering the questions they were really trying to ask. This was key. This role isn’t simply technical; you need to show you can think beyond the dashboard in front of you, placing it in the real world and identifying how relevant—or irrelevant—its insights are to the overarching question.
Upon understanding this, I (funnily enough) performed much better this time around and managed to earn my place in DS47! What a relief...
The Future
This application process is a pretty mammoth task, especially for those of us who needed to take a second shot! This, of course, is somewhat the point. It filters out those who can derive some sort of (masochistic?) enjoyment from the process. I’ve earned my place here, and despite the effort of my prolonged application, I’m grateful for the unique hiring approach. I, along with other career changers like me, would simply not get a look-in at other highly competitive roles using the traditional CV approach. If you find yourself in a similar position to the one I was in, consider giving it a go! You might discover that you enjoy it.
Having come out on the other side and finally landed the job, I couldn't be more excited about the future opportunities that were previously inaccessible to me. I now have four months of paid training to dive into! I will be learning cutting-edge industry skills and building up my CV through exciting placements with Information Lab clients. Onwards and upwards!