


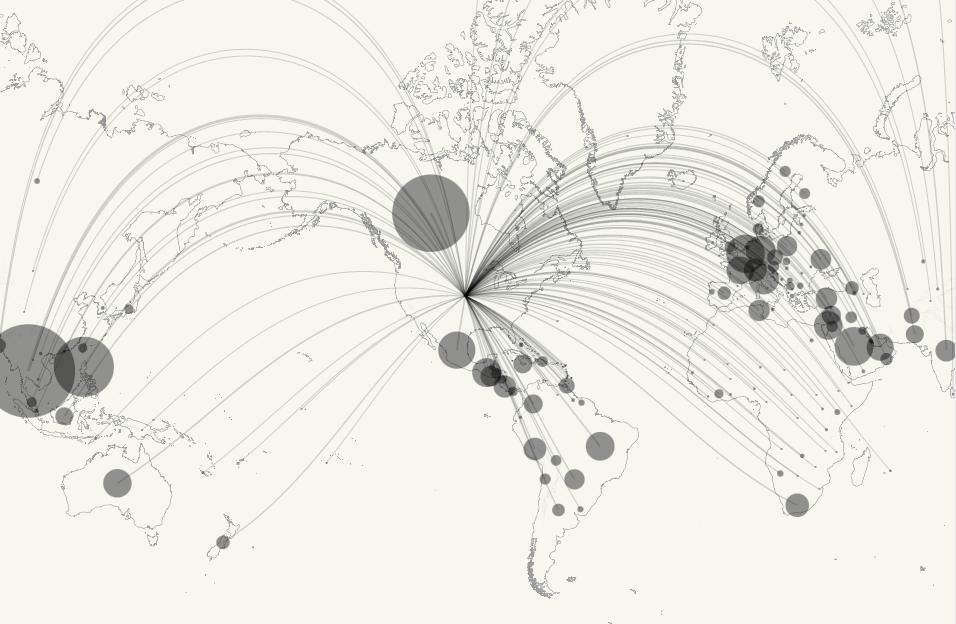
Flow maps allow us to show movement from one location to another, the quantity of which can be signified by line width, color, or another mark. In my example below I depicted quantity with a proportional symbol map (the grey circles). This allowed me to keep the lines thin and the chart clean.
So how do we build such a chart? It is actually pretty straight forward, so long as we have the longitude and latitude for our origin and destination points.
Step 1: Create Spatial Objects
First we have to create spatial objects from our longitude and latitude fields. We much do this for our origin, and our destination points. To do this, create a calculated field and use the in built MAKEPOINT() function. Here is mine for my destination coordinates:
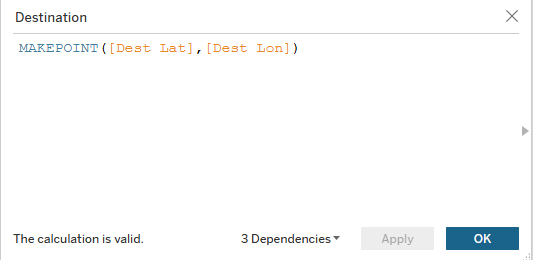
This will create a spatial point for each row in the dataset. Repeat for the Origin coordinates.
Step 2: Connect Spatial Points
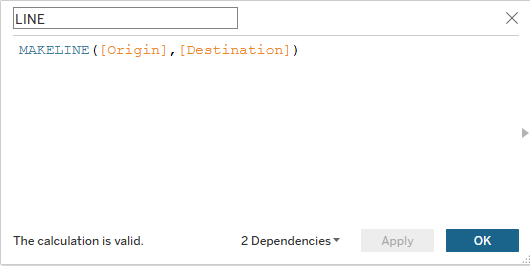
Now we need to connect our spatial points with lines. Funnily enough this is where the MAKELINE() function comes in handy. Create another calculation, and input MAKELINE([Origin Points],[Destination Points]). Here is mine:
Step 3: Build the Map
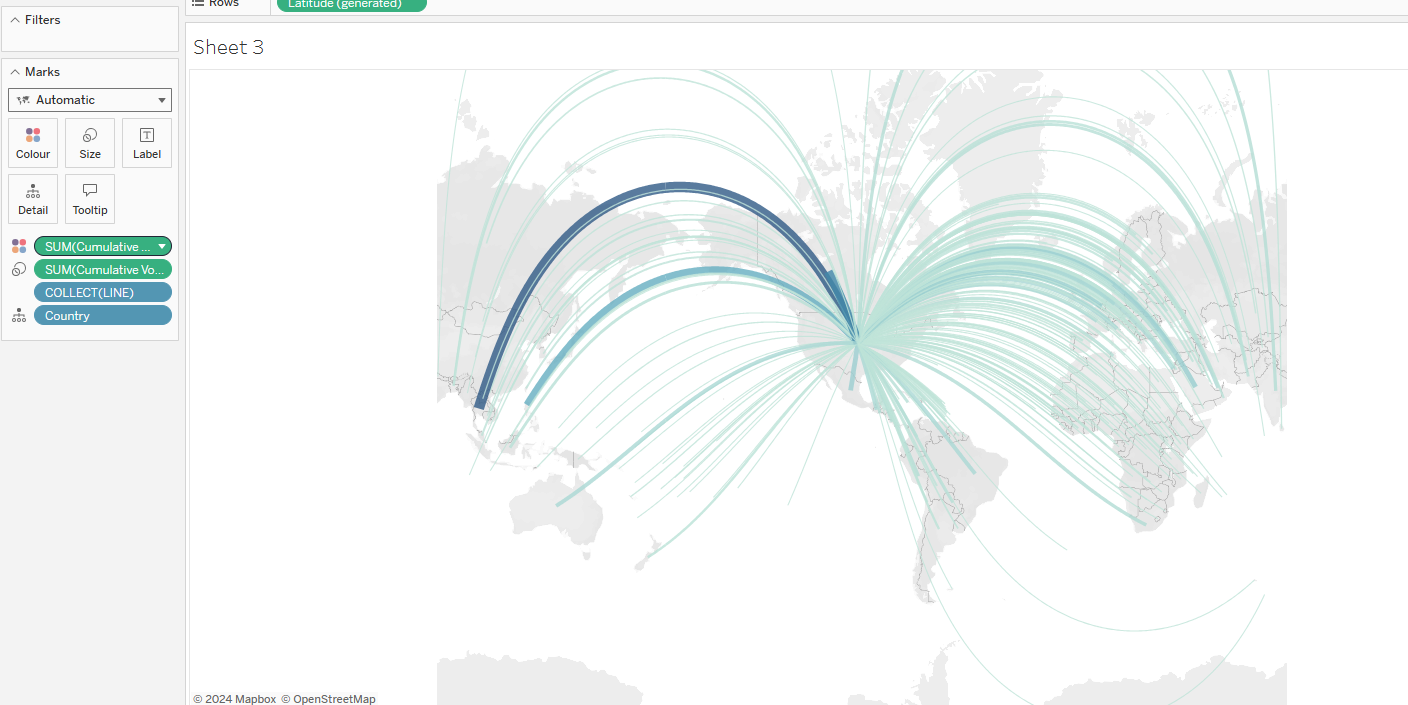
Drag your Line Calculation onto detail on the marks card of a blank sheet and you should see your flow lines appear:
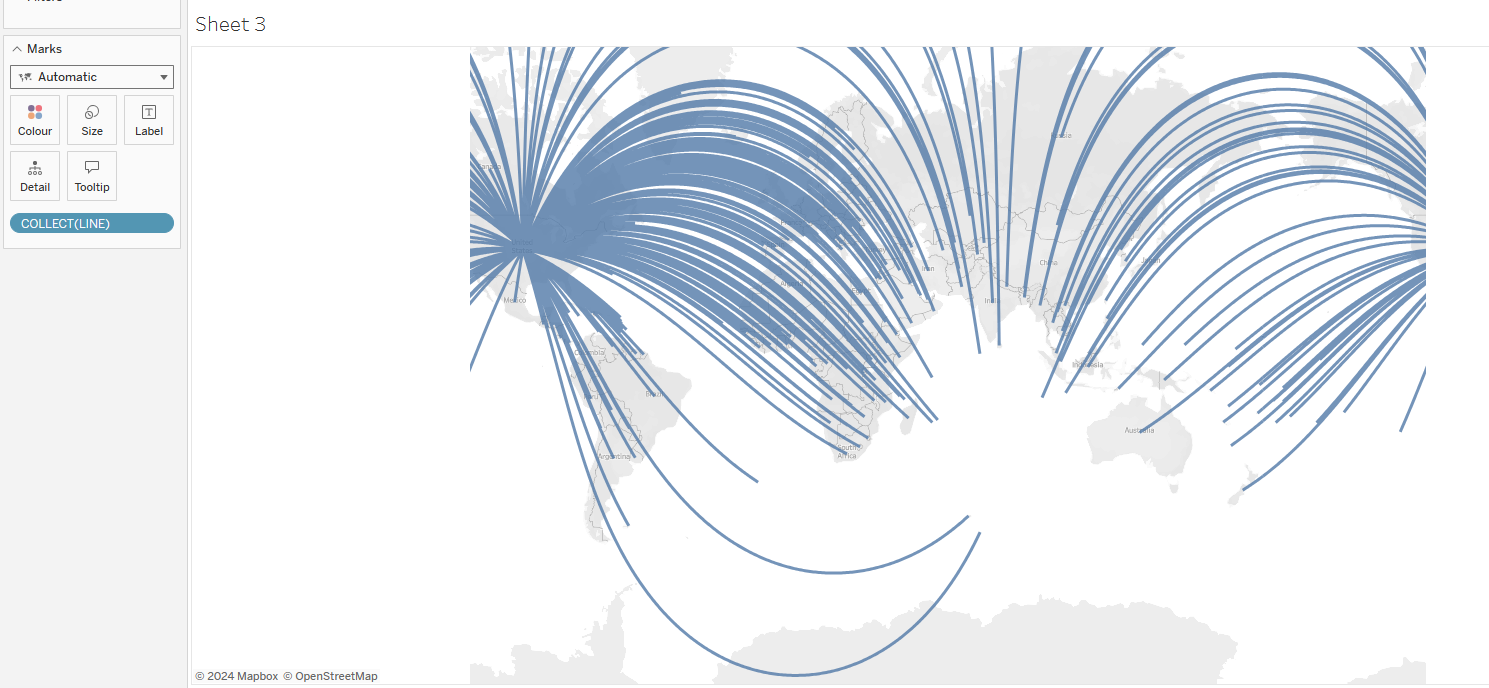
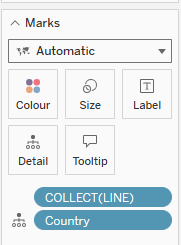
You'll notice that the lines all highlight at once, as if it is one single shape. To deal with this we need more detail! In my case, this means dragging country to detail on the marks card also:
Step 4: Depict Quantity
There several different ways to do this, size and color of lines would be the most common. To do this, drag your measure to color, and or size, on the marks card!
In my initial example, I wanted to keep my lines thin and black, so I showed quantity with a duel axis chart. I dragged another generated latitude field to rows, and on the marks card of this chart put Country onto detail and a duplicated field of my measure onto size:
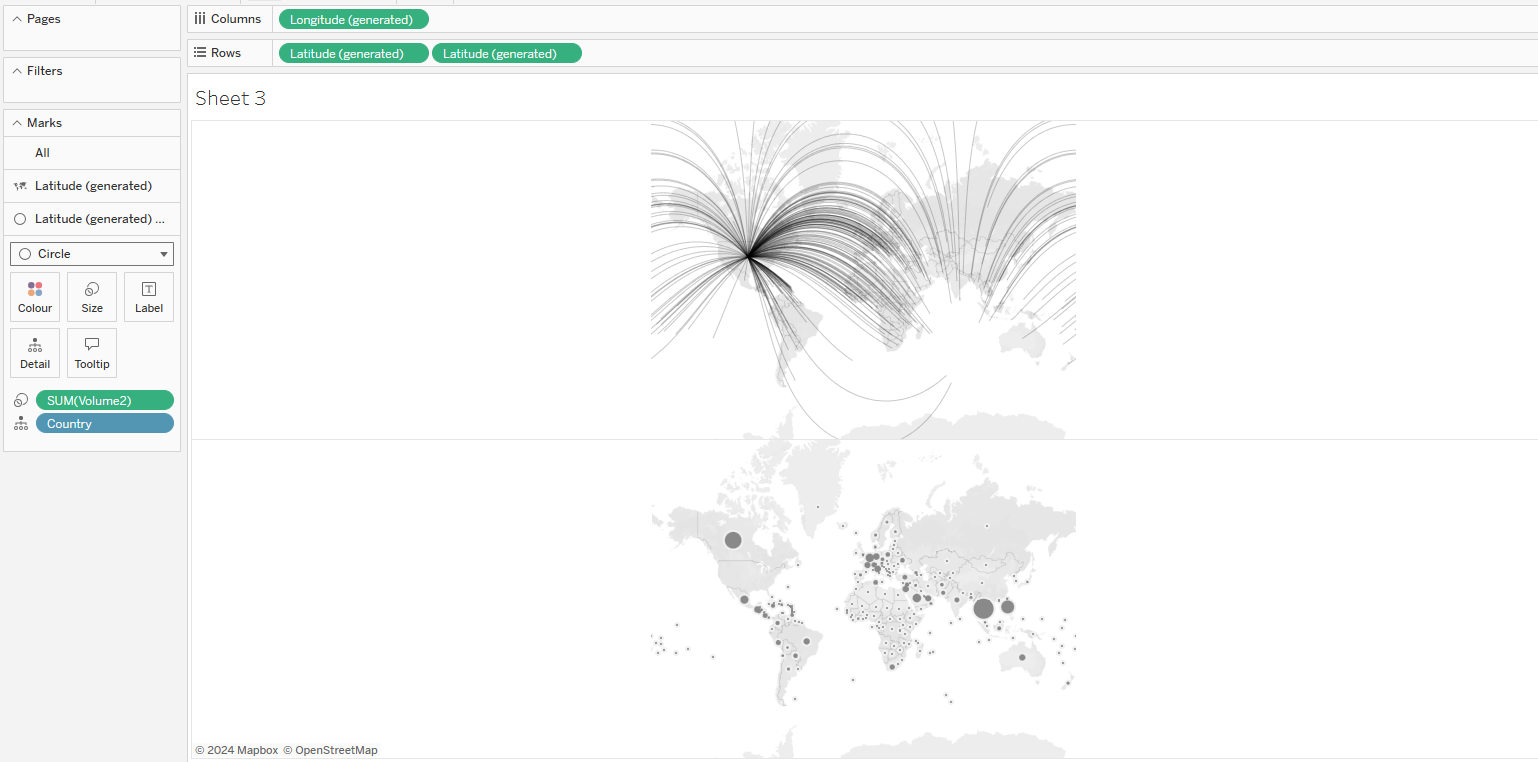
And from here, just right click on the rows pill and select duel axis:
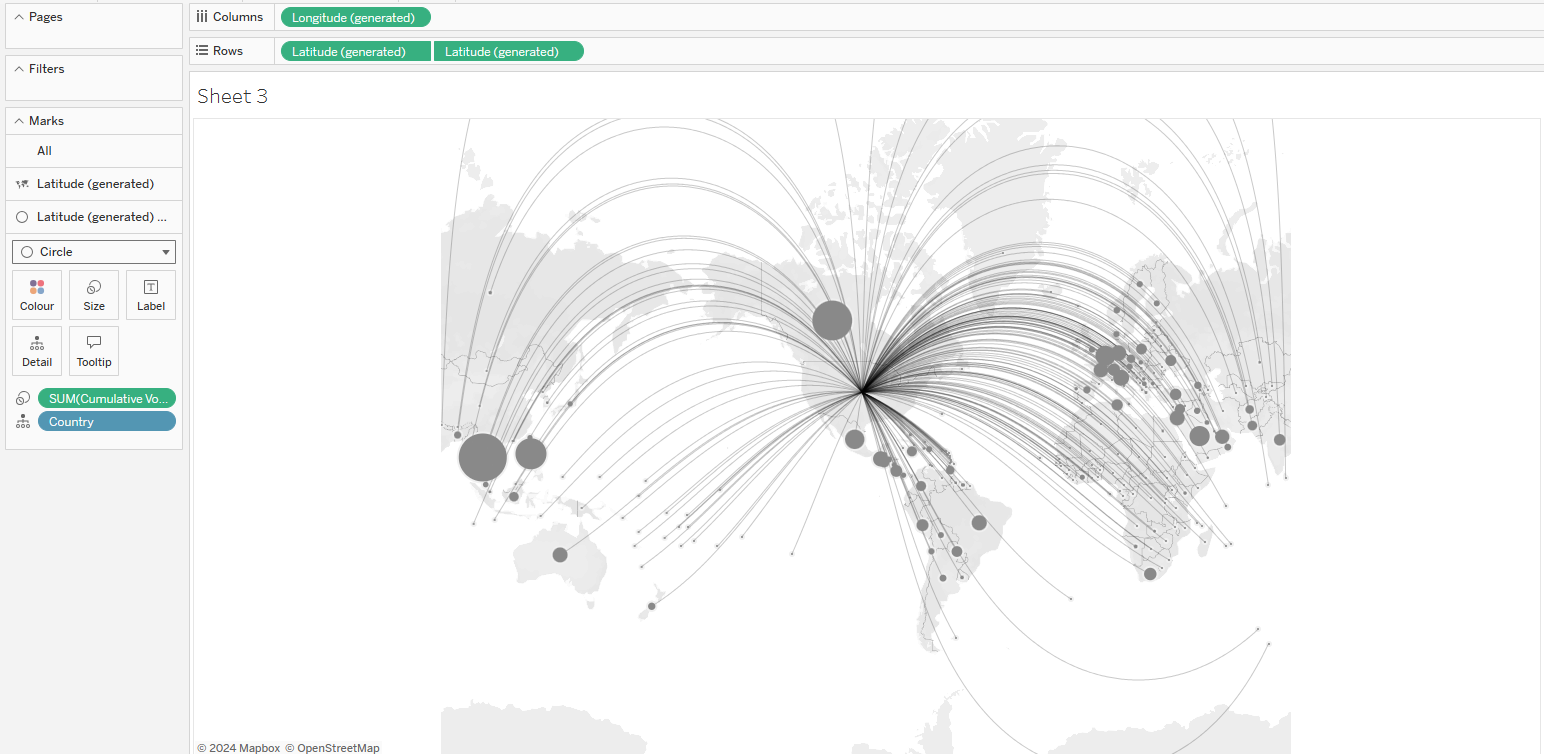
Voila! A classy looking flow map to impress your friends with.