


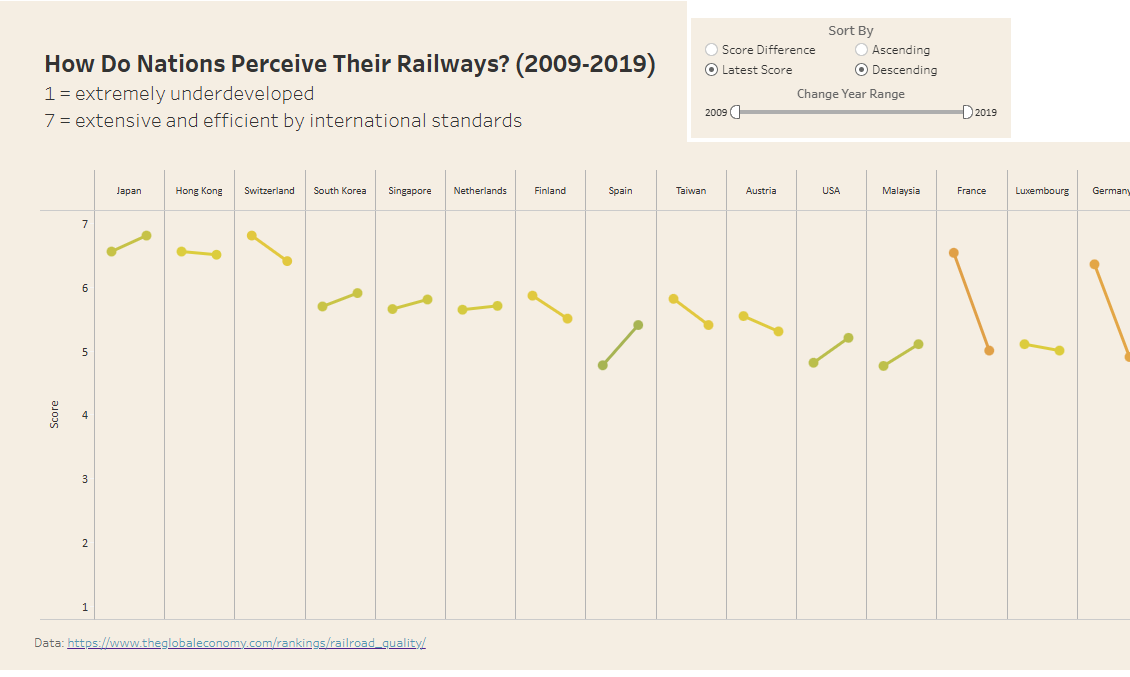
Sometimes you may want your user to be able to select how they would like a chart be sorted; which measures to sort by, and whether it is ascending or descending. As with so many things, we can get this done with parameters!
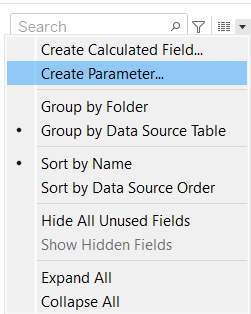
Step 1: Create Your Parameters
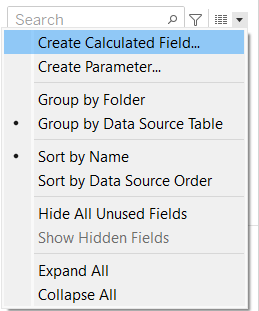
Select create parameter:
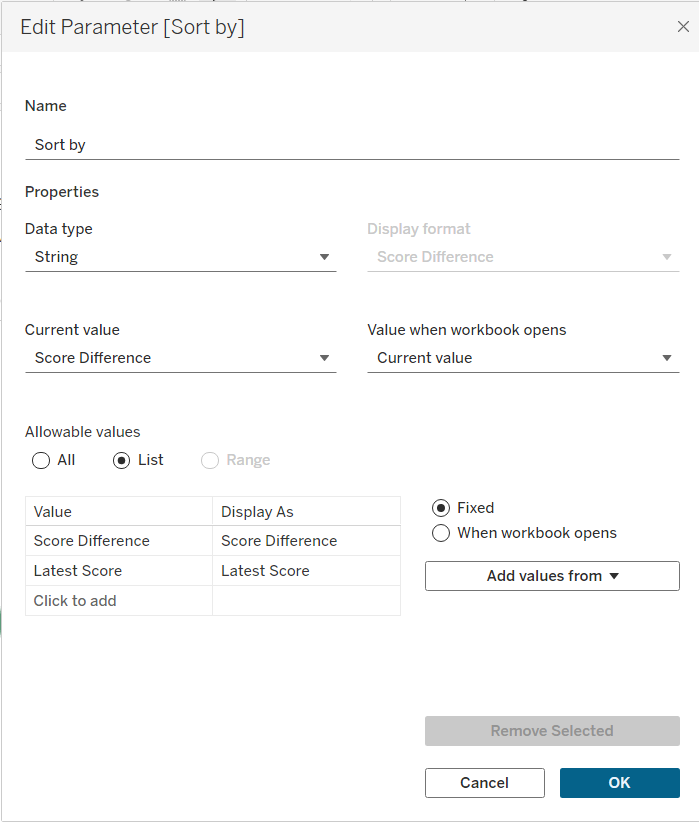
Name your parameter, change data type to string, select list, and input the names of the measures you would like the user to have the ability to sort by:
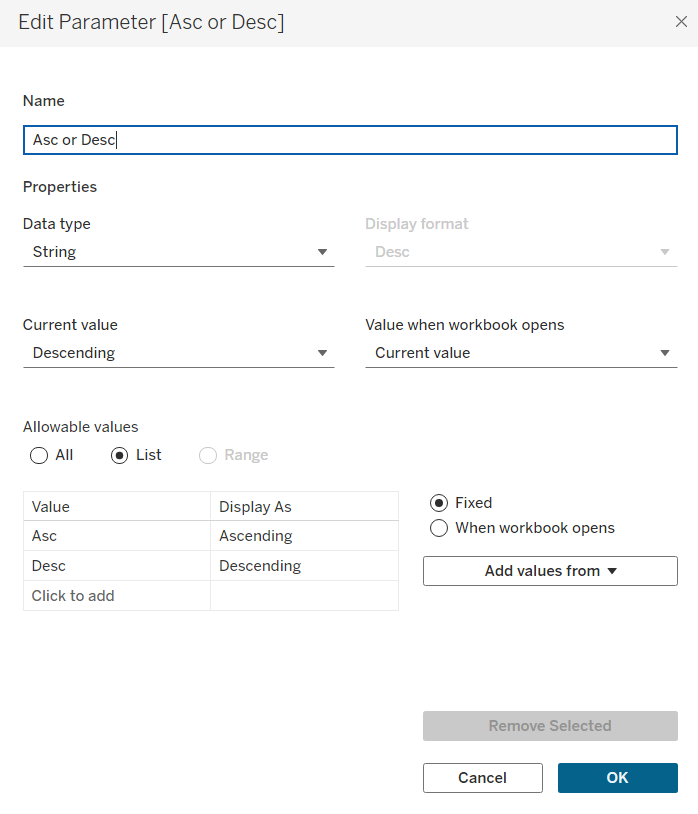
Repeat the above step for an ascending/descending parameter if you would like the user to have this option:
Step 2: Create Calculations for Parameters
These parameters are not functional just yet, we need calculations to connect them to the data! Create a calculated field:
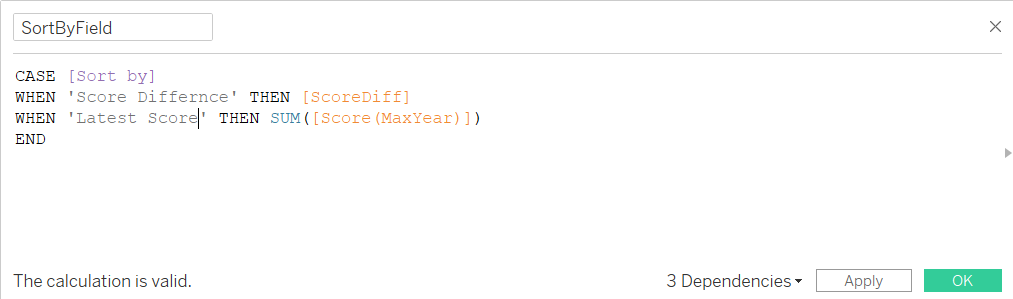
and use a CASE statement so that the values change depending on the parameter selection:
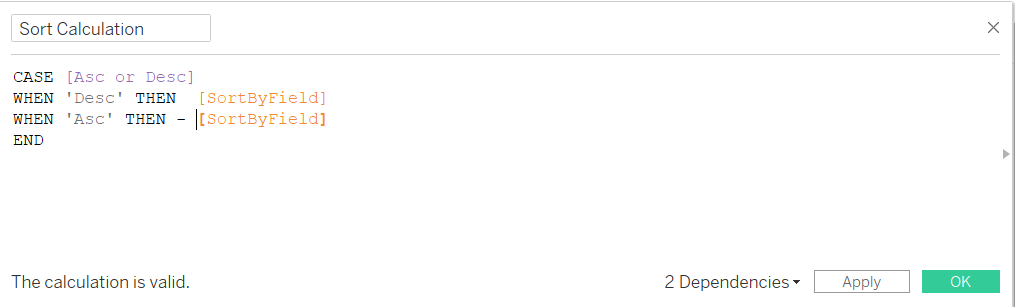
And now we need this new field to be affected by our ascending/descending parameter. Create another calculated field:
Step 3: Sort by Calculated Field
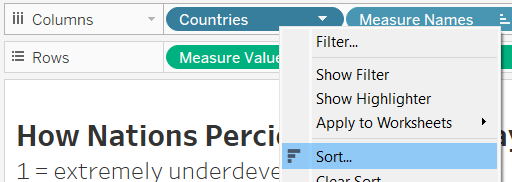
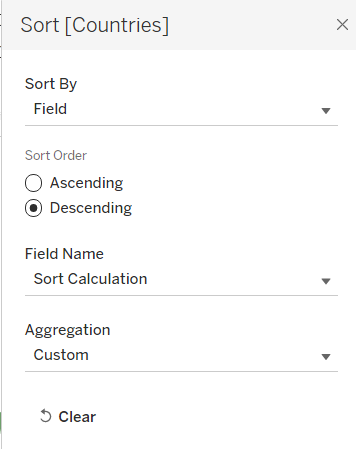
Right click on the dimension pill you want to sort, and select Sort:
Select 'Sort By Field' and input our calculated field:
Now find your parameters on the data pane to the left of the screen, right click and select 'show parameters'. You should now be able to select your desired sort options and watch the chart change to fit - magic!