What are bins?
In short words, bins are the groups in which our data is “contained”, such as categories, dates or range of numbers. It is important to keep in mind that when we talk about bins in Tableau we are usually referring to “numerical bins” , however, “any discrete field in Tableau can be considered as a set of bins” (Tableau).
Why do we need numerical bins?
When we work with data, our continuous data (such as sales or profit) it is usually grouped under some categorical field. Normally these fields would be our discrete variables in the data set, such as “Country” or “Category”. Nevertheless, sometimes we would like to group our data under numerical ranges. One of the cases in which we would like to do that would be when building histogram charts. For example, if I’m analysing house prices, I may want to group my data by different price ranges, such as “low price”, “medium price” or “high price”; this is when we would create a bin based in a numeric dimension.
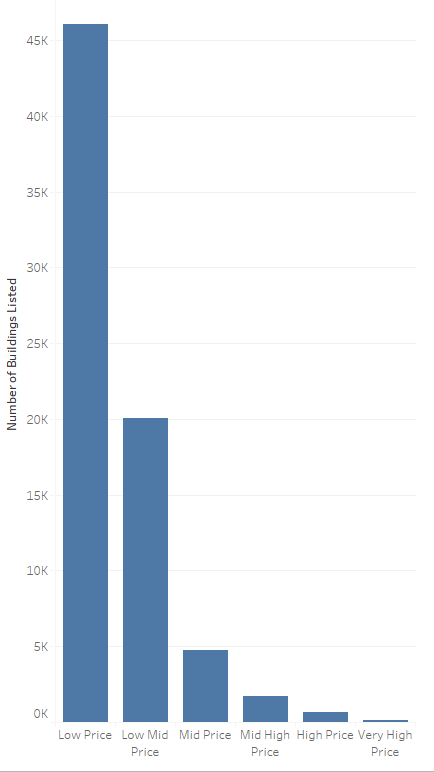
Figure 1. Numerical bin example
Creating the bins:
Bins work with numeric data; therefore, you will only find the option to create them if the data is in this format (including latitude and longitude points). To create a bin, the straightforward way to do it is to right click over the field you want to bin.
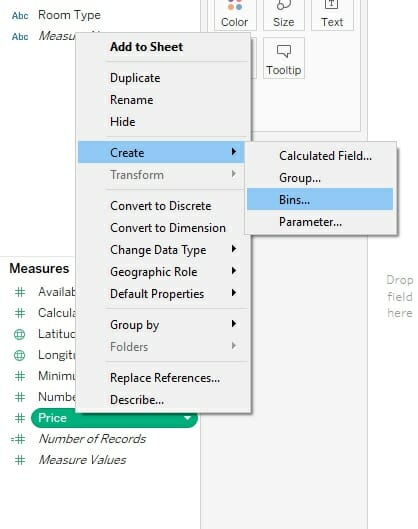
Figure 2. Creating a bin
.
When you select the bin option a window will pop-up asking for different values:
- Field Name: Your new bin will show up as new field, similarly to the way a new field is generated when you create a new group in your data. However, in this case it will be represented by a “histogram” symbol next to it. As this is a new field, it will require a name.
- Size of bins: The size of bins corresponds to the range of values that will be contained within each of the bins. This number will depend in which purpose your bin is serving. By default, Tableau will assign you the size that it believes its distributes your data more optimally. The formula for this is:
Number of Bins = 3 + log2(n) * log(n)
However, you are free to assign any value that you prefer and even assign dynamic values by using a parameter.
Dynamic bin size:
Assigning a dynamic bin size gives the user the freedom to decide their own bin size, according to what they consider relevant. Going back to the house price example, maybe you consider a “low price” rental everything under £100 a night, whilst your user may want to see the granularity of houses under £50. This is when we would use a parameter.
Creating the parameter:
Parameters work in many ways and have different functions across Tableau. For simplification purposes I will focus on parameters for bins.
Whilst you can create a parameter by right clicking in your side bar and choosing “create a parameter”, the straightforward method to create a parameter for a bin is slightly different. If we go back to the step when we were creating our bin, you will notice that when selecting a size of bins, it shows the option to “create a new parameter” .
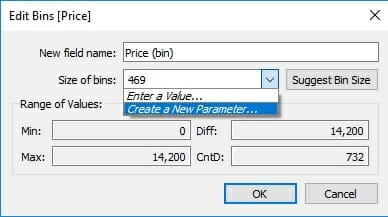
Figure 3. Creating a parameter for the bin.
If you select on this option, your parameter will come “pre-configured” to the data type of your bin. That said, as your data type is numerical, the parameter will only take “Float” data type. Here you will have different options:
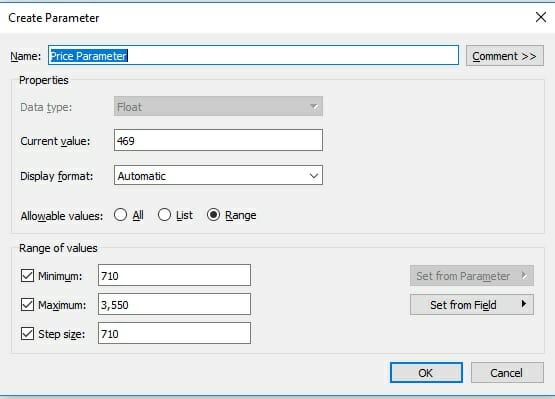
Figure 4. Configuring the Parameter
- Current Value: This is the number that your parameter will show by default.
- Display Format: Here you can select the number format of your parameter, such as number, currency or percentage.
- Allowable Values: These are the values that your parameter will display. You can select “all” the values in the data set, create a list of possible values or select a range of values.
- Range of Values: If you select a range of numbers you will have to define the minimum, maximum and step size (which is the gap between points within the range).
Finally, the last step is to make sure to configure your parameter card as it suits you better, this can be a slider, list or just typing it in.
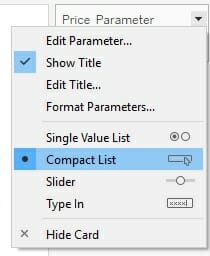
Figure 5. Formatting the parameter.
.
That’s it! Now you are all set to go with your dynamic bins!
