When we input data into Tableau, Tableau automatically separates this data into two categories, dimensions and measures. Understanding the difference between the two will save you a lot of time when you are looking for specific field. In Tableau dimensions appear in blue and measures are shown in green.
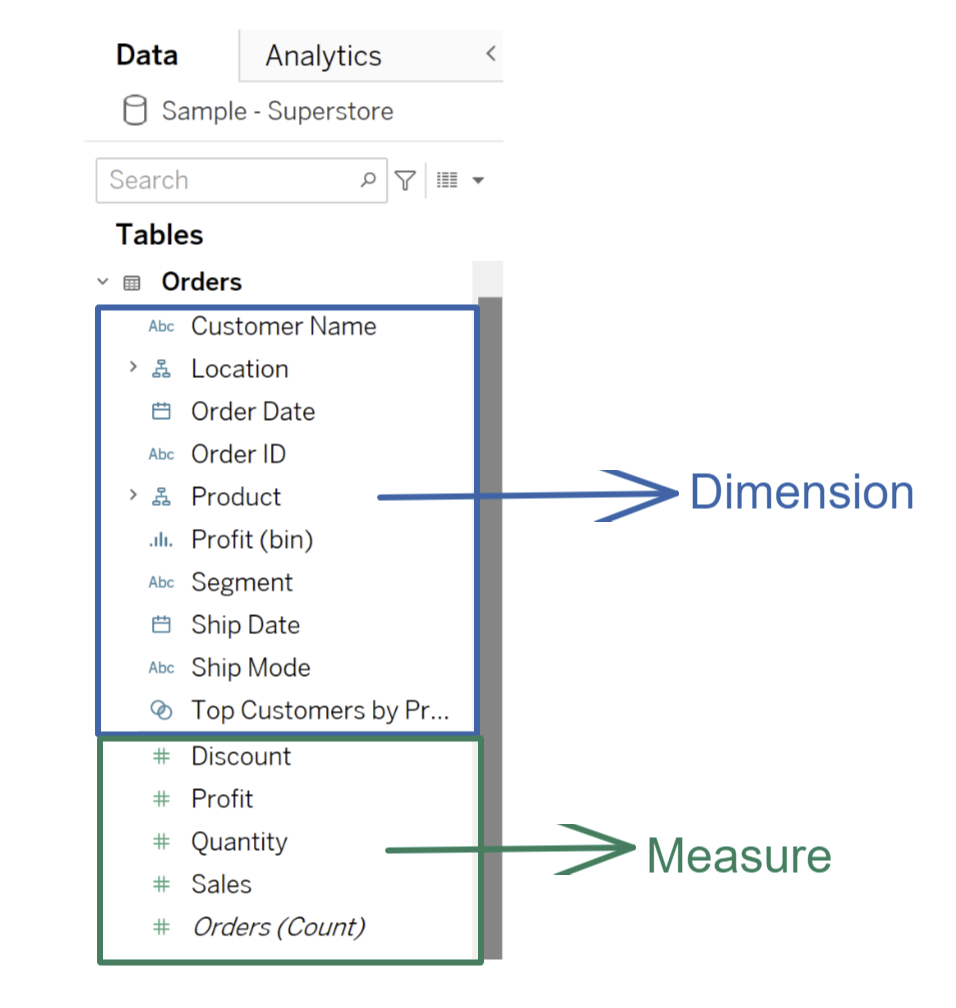
Dimensions in Tableau are used to split up the view, it is qualitative/categorical data (e.g. location, dates etc.) When added to the row or column, it can be used to compare different categories and on filters it can be used to exclude categories.
Measure is quantitative data (profit, sales, discount etc.,) Tableau will automatically assign a numeric filed as a measure.
|
Dimension |
Measure |
|
Independent variable |
Dependent variable |
|
Cannot be aggregated |
Can be aggregated |
|
Generates headers |
Creates axis |
|
Qualitative date |
Quantitative data |
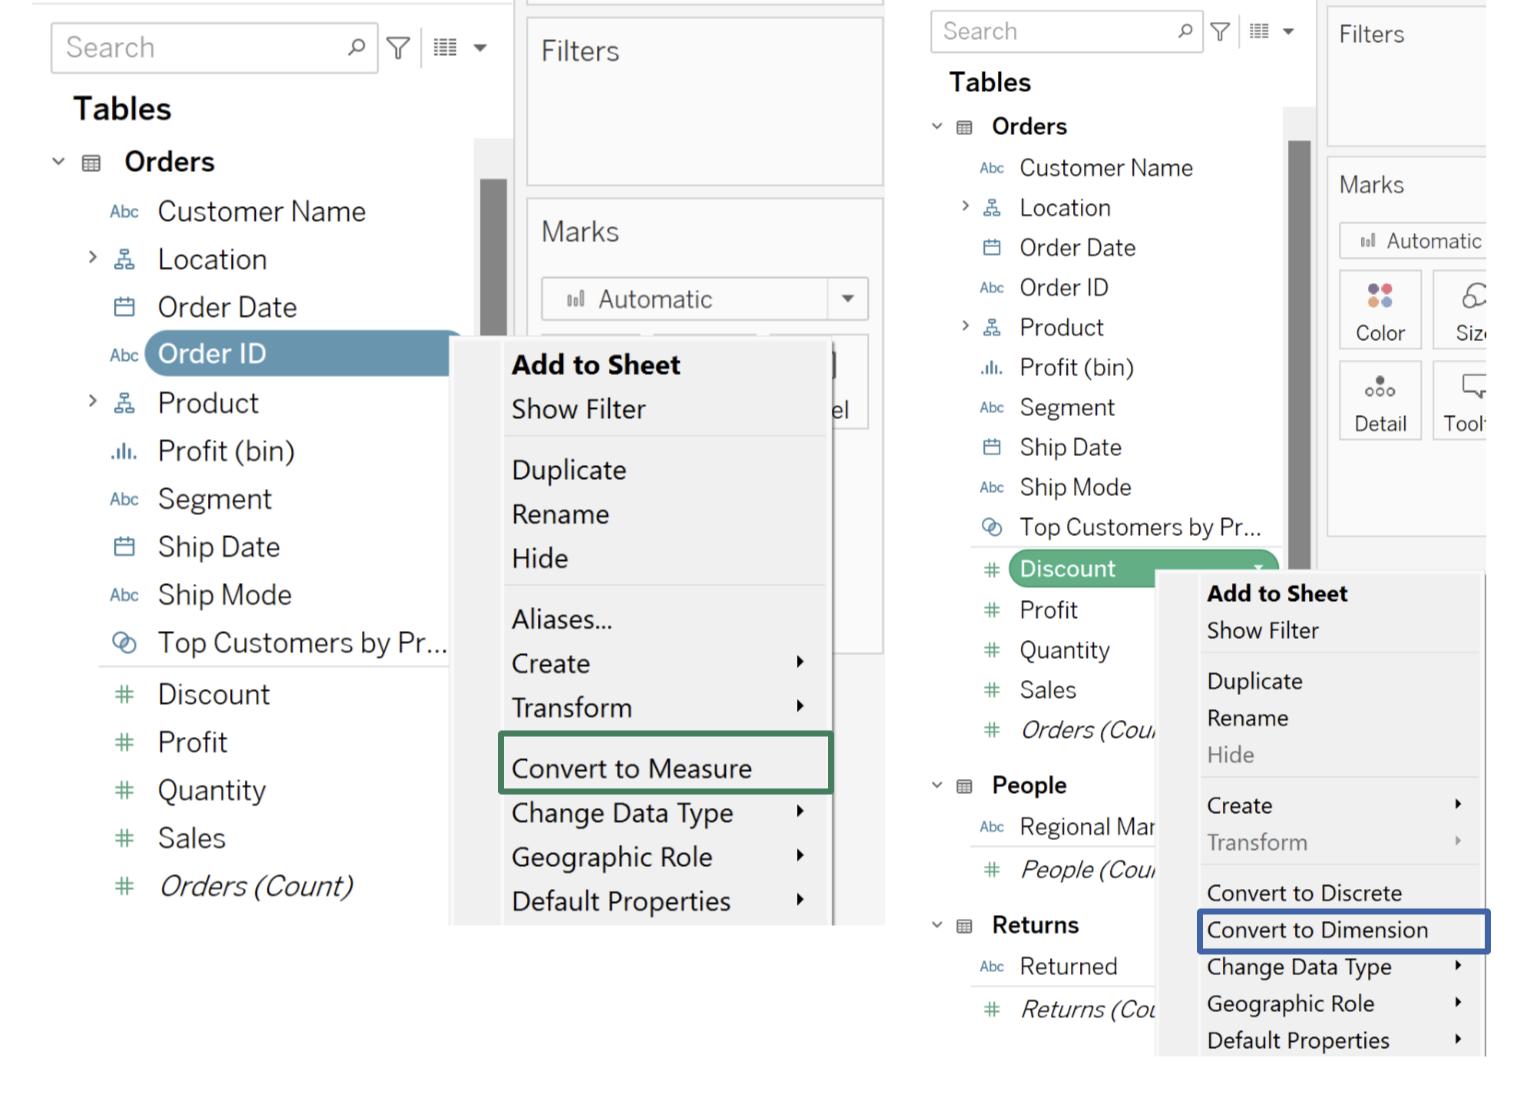
Sometime Tableau incorrectly categories fields. In this case, simple right click the field and select either convert to dimension or convert to field.