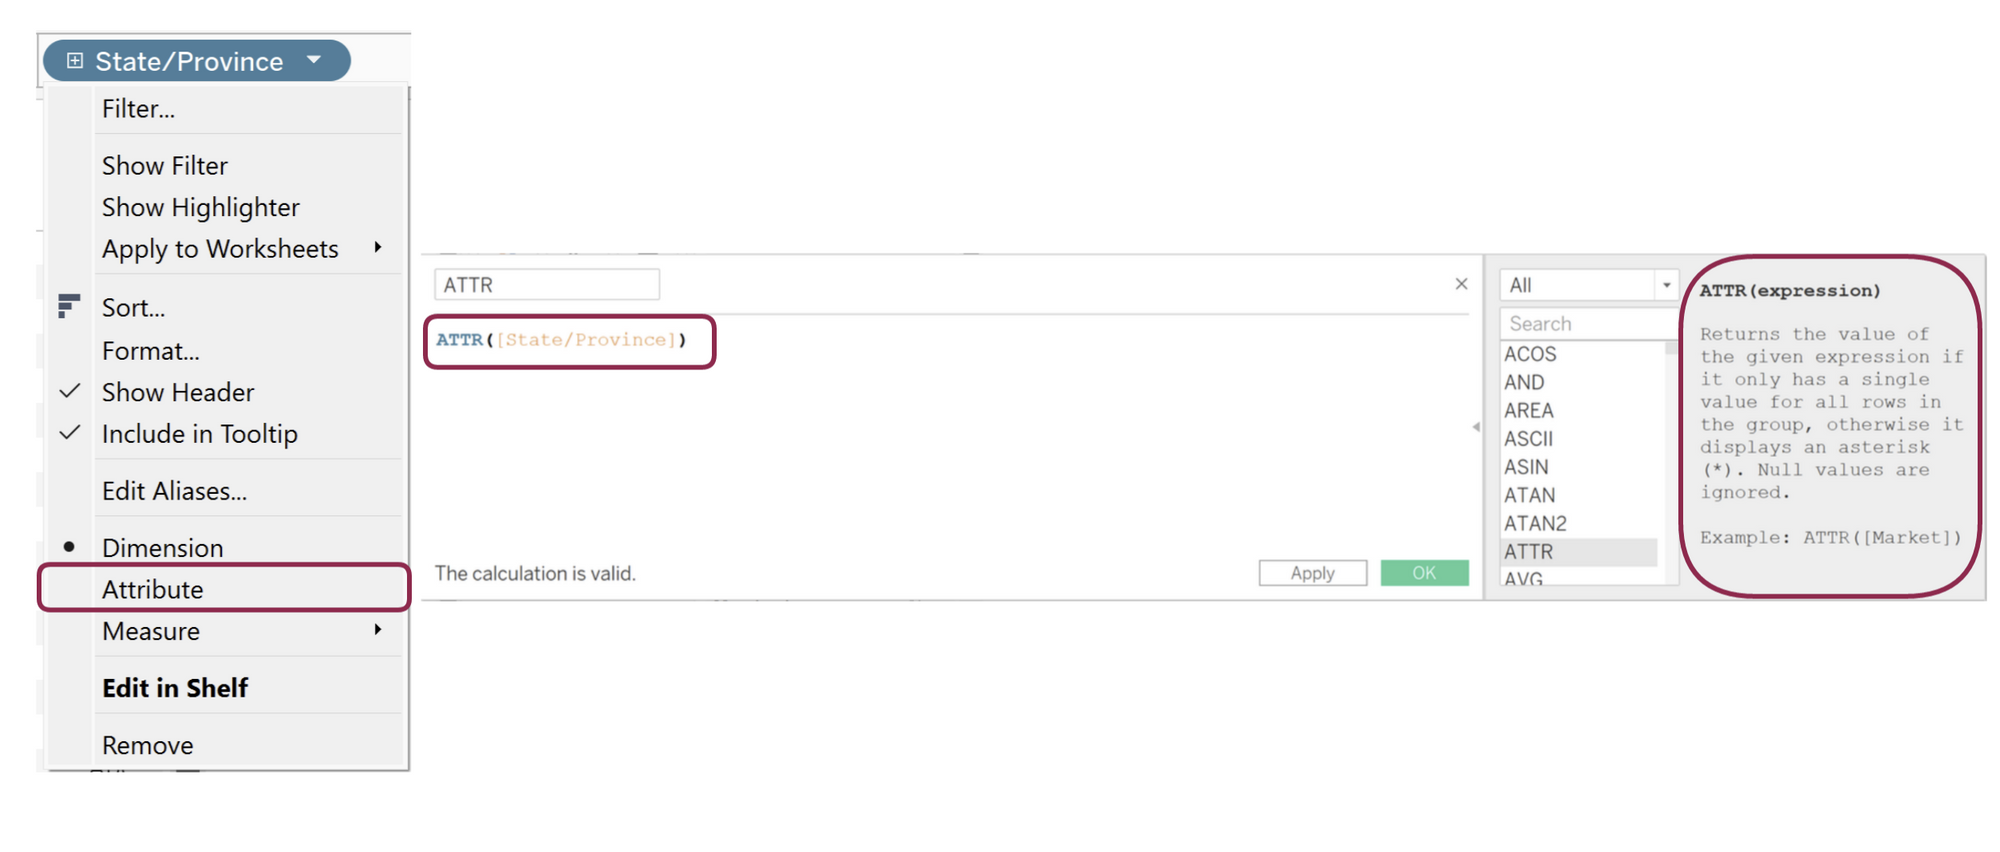
Attribute function is a type of aggregation in Tableau that works on dimensions fields. It works by returning a value for an expression if it only has a single value for all the rows in the group (excluding nulls). If there are multiple values in the group, then an asterisk (*) is returned.
An attribute can be created by right clicking a dimension on row/column and selecting attribute or by creating a calculated field and wrapping your dimension in an attribute.

How does it work:
IF MIN([dimension]) = MAX([dimension])
THEN
MIN([dimension]) //whether you return the first or last or anything in between, if the values are the same the result will not change
ELSE
“*”
END
This means in simple English, if the first value is the same as the last value (or all the values are the same), give me back the first value, if not return an asterisk to let me know there are multiple values.
Below we can see the affect an attribute has on our view. On the rows we see there are cities with more than one state. There is an Apple Valley in California and Minnesota.
Without the attribute the view is broken up showing the sales in Apple Valley in both California and Minnesota. After State/Province in turned to an attribute we see that the sum of sales has been aggregated to give the total of the two states for that city and an asterisk has replaced the two states.

Use Case:
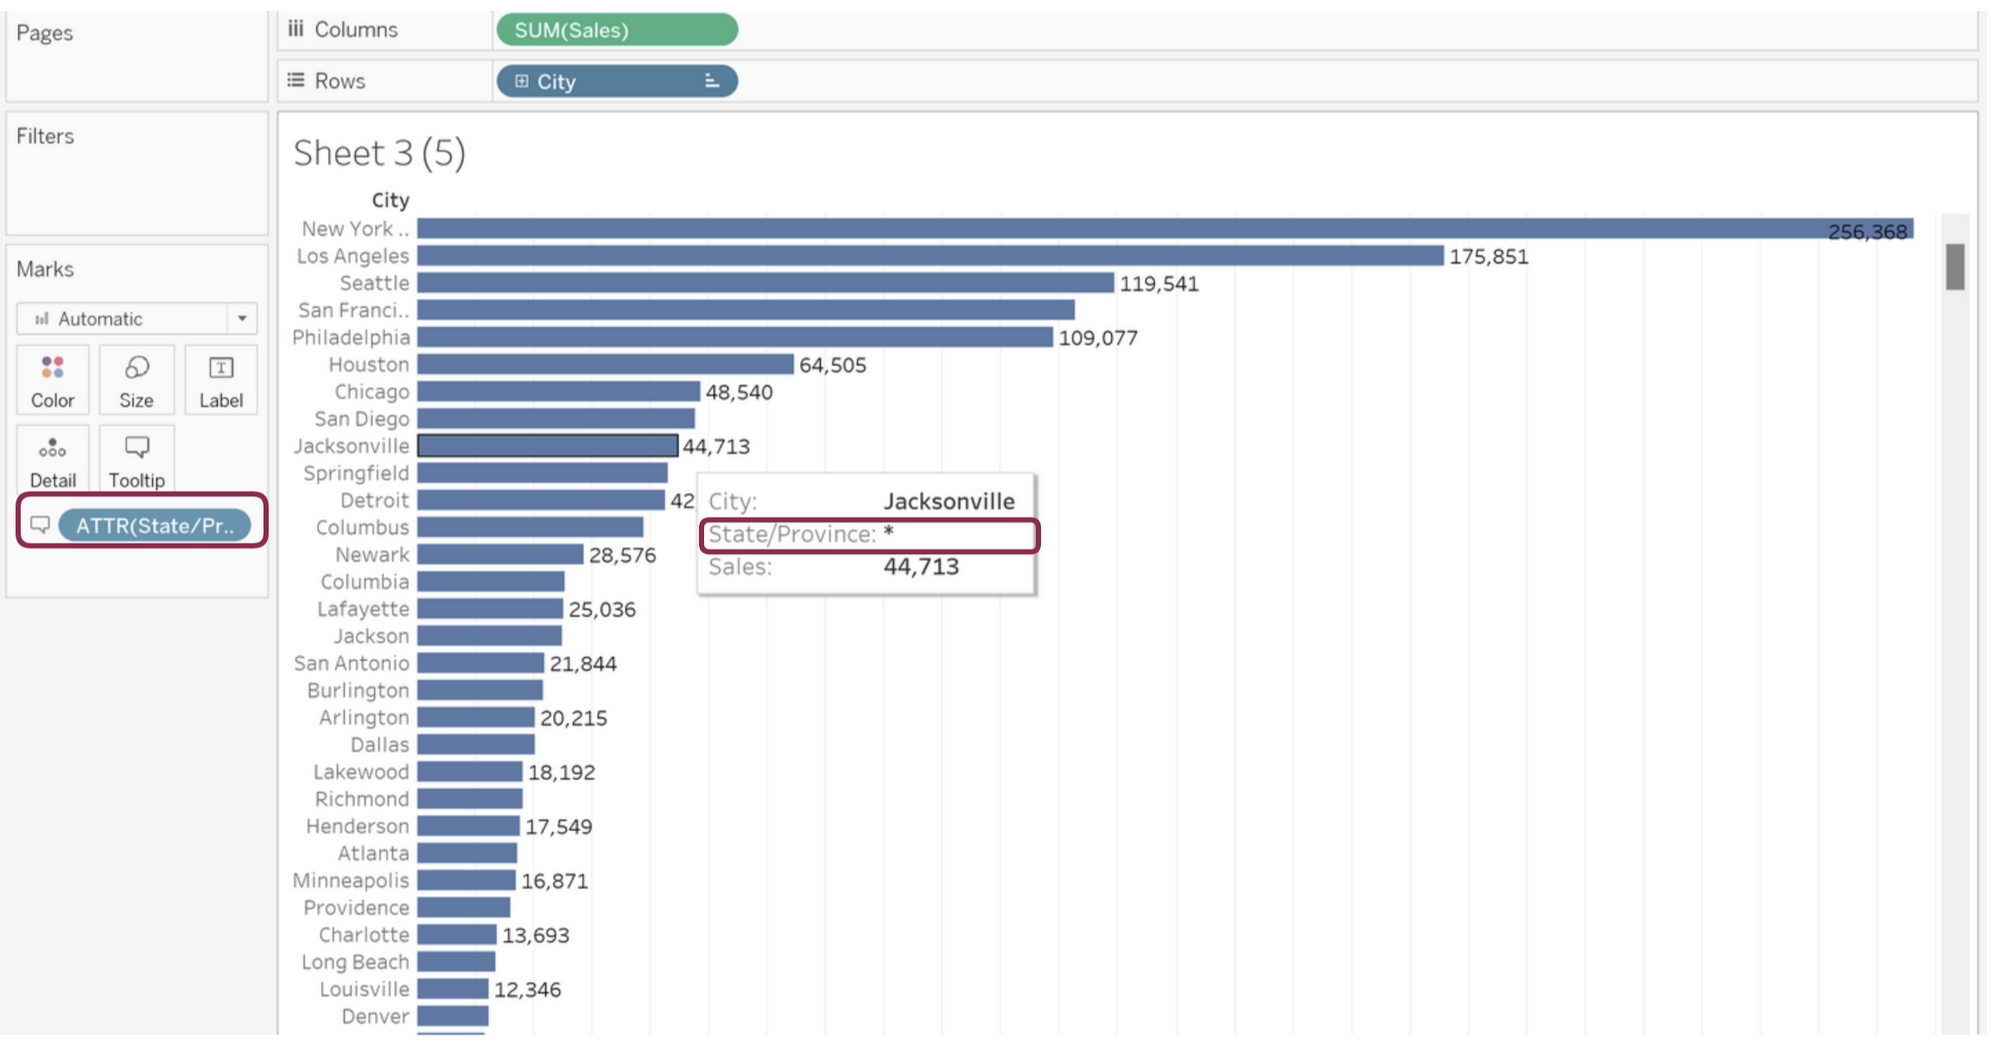
We want to see the sales for each city and when we hoover over the bar we want to know the state(s) the city is in.
Notice when we bring the dimension (State/Province) to tooltip it automatically aggregates to an attribute.

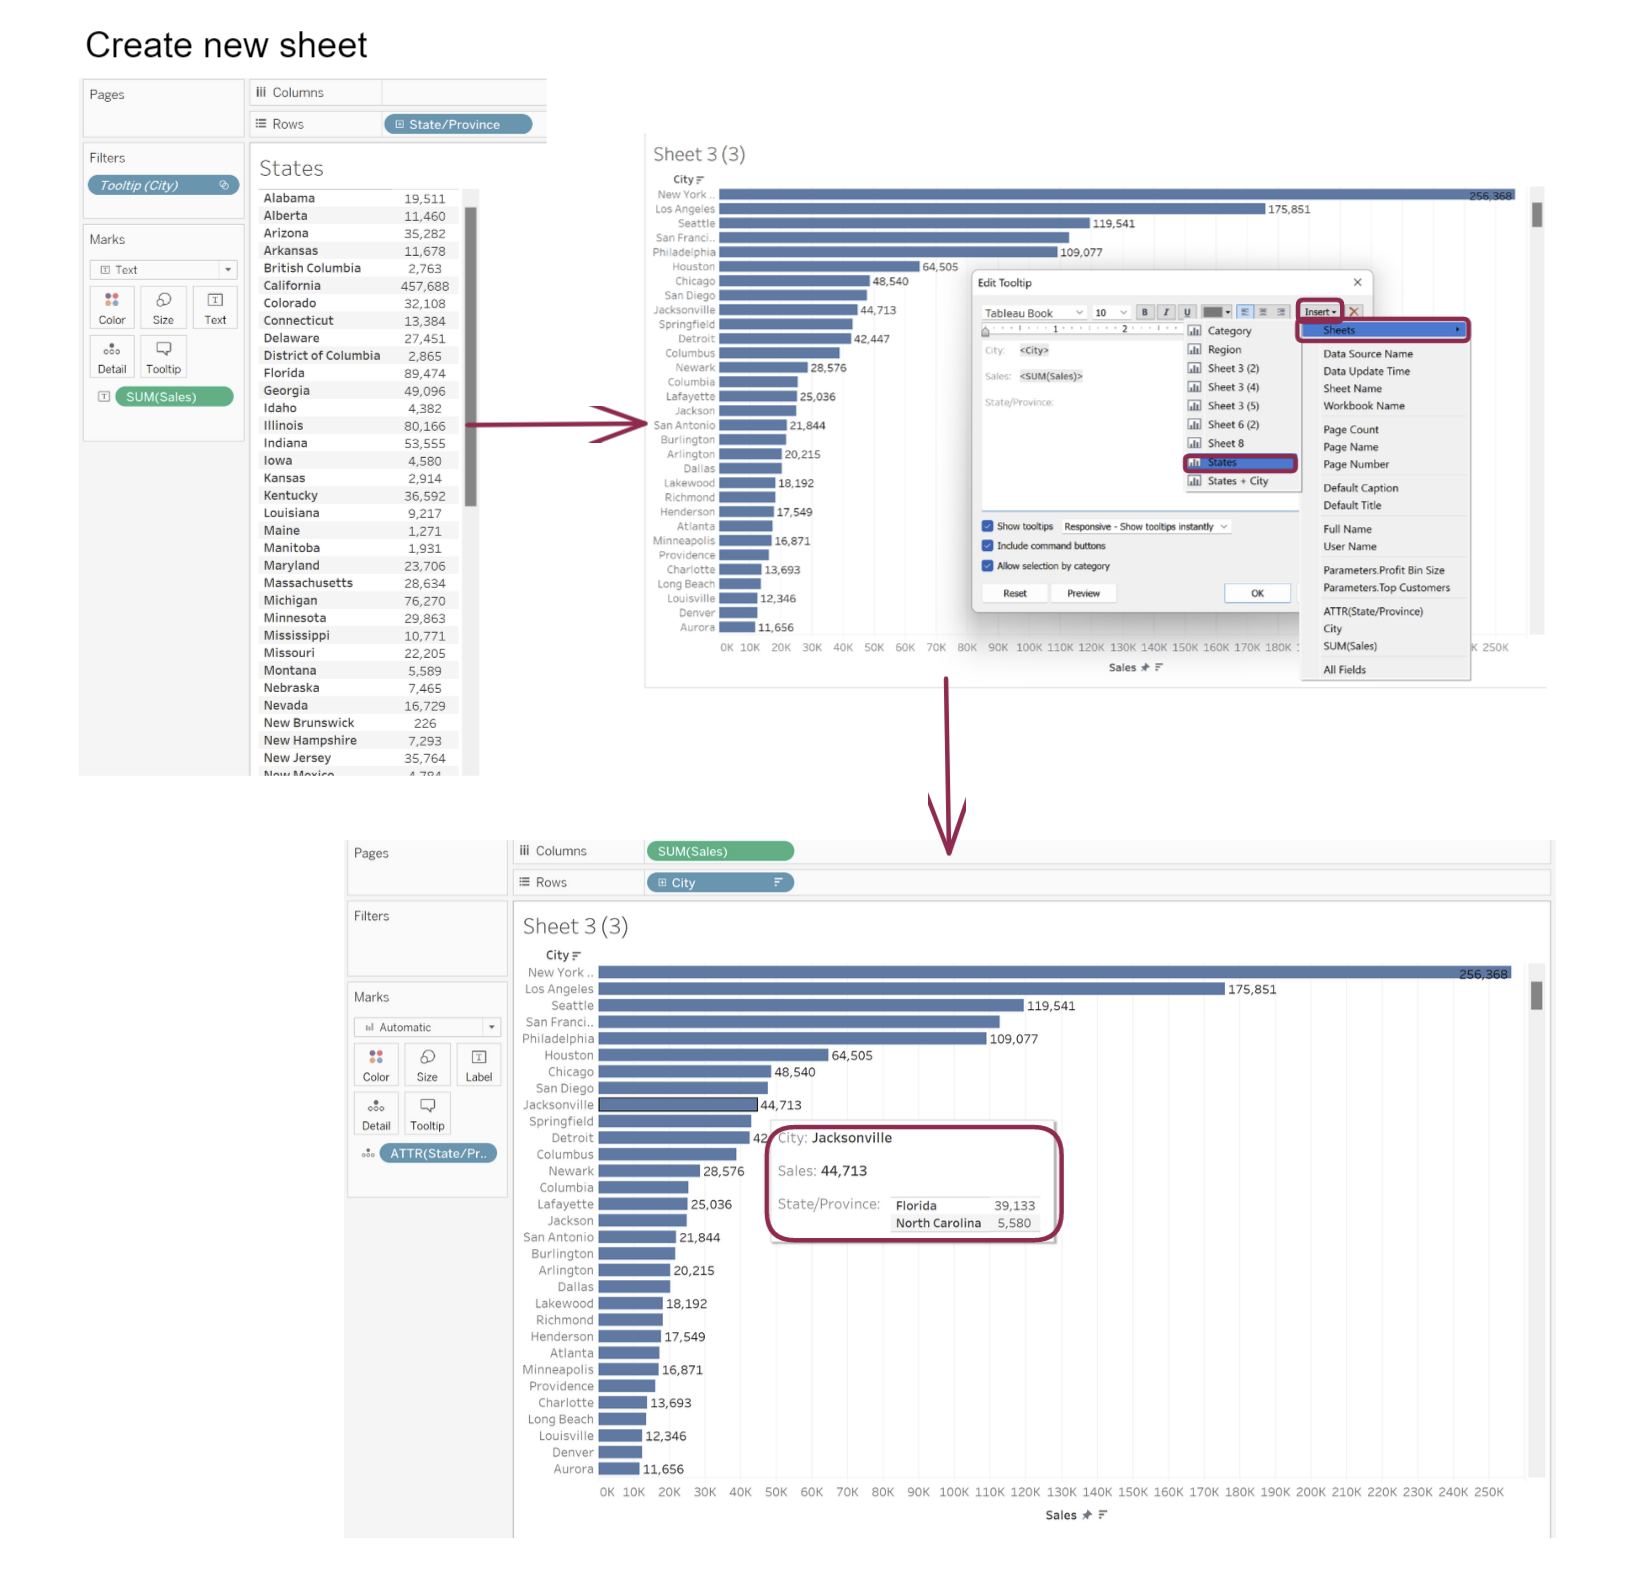
A method to overcome the * every time there are multiple states is by creating a separate sheet with State/Province on row and sales on text and inserting it to tooltip of the previous graph. Like shown below.

