


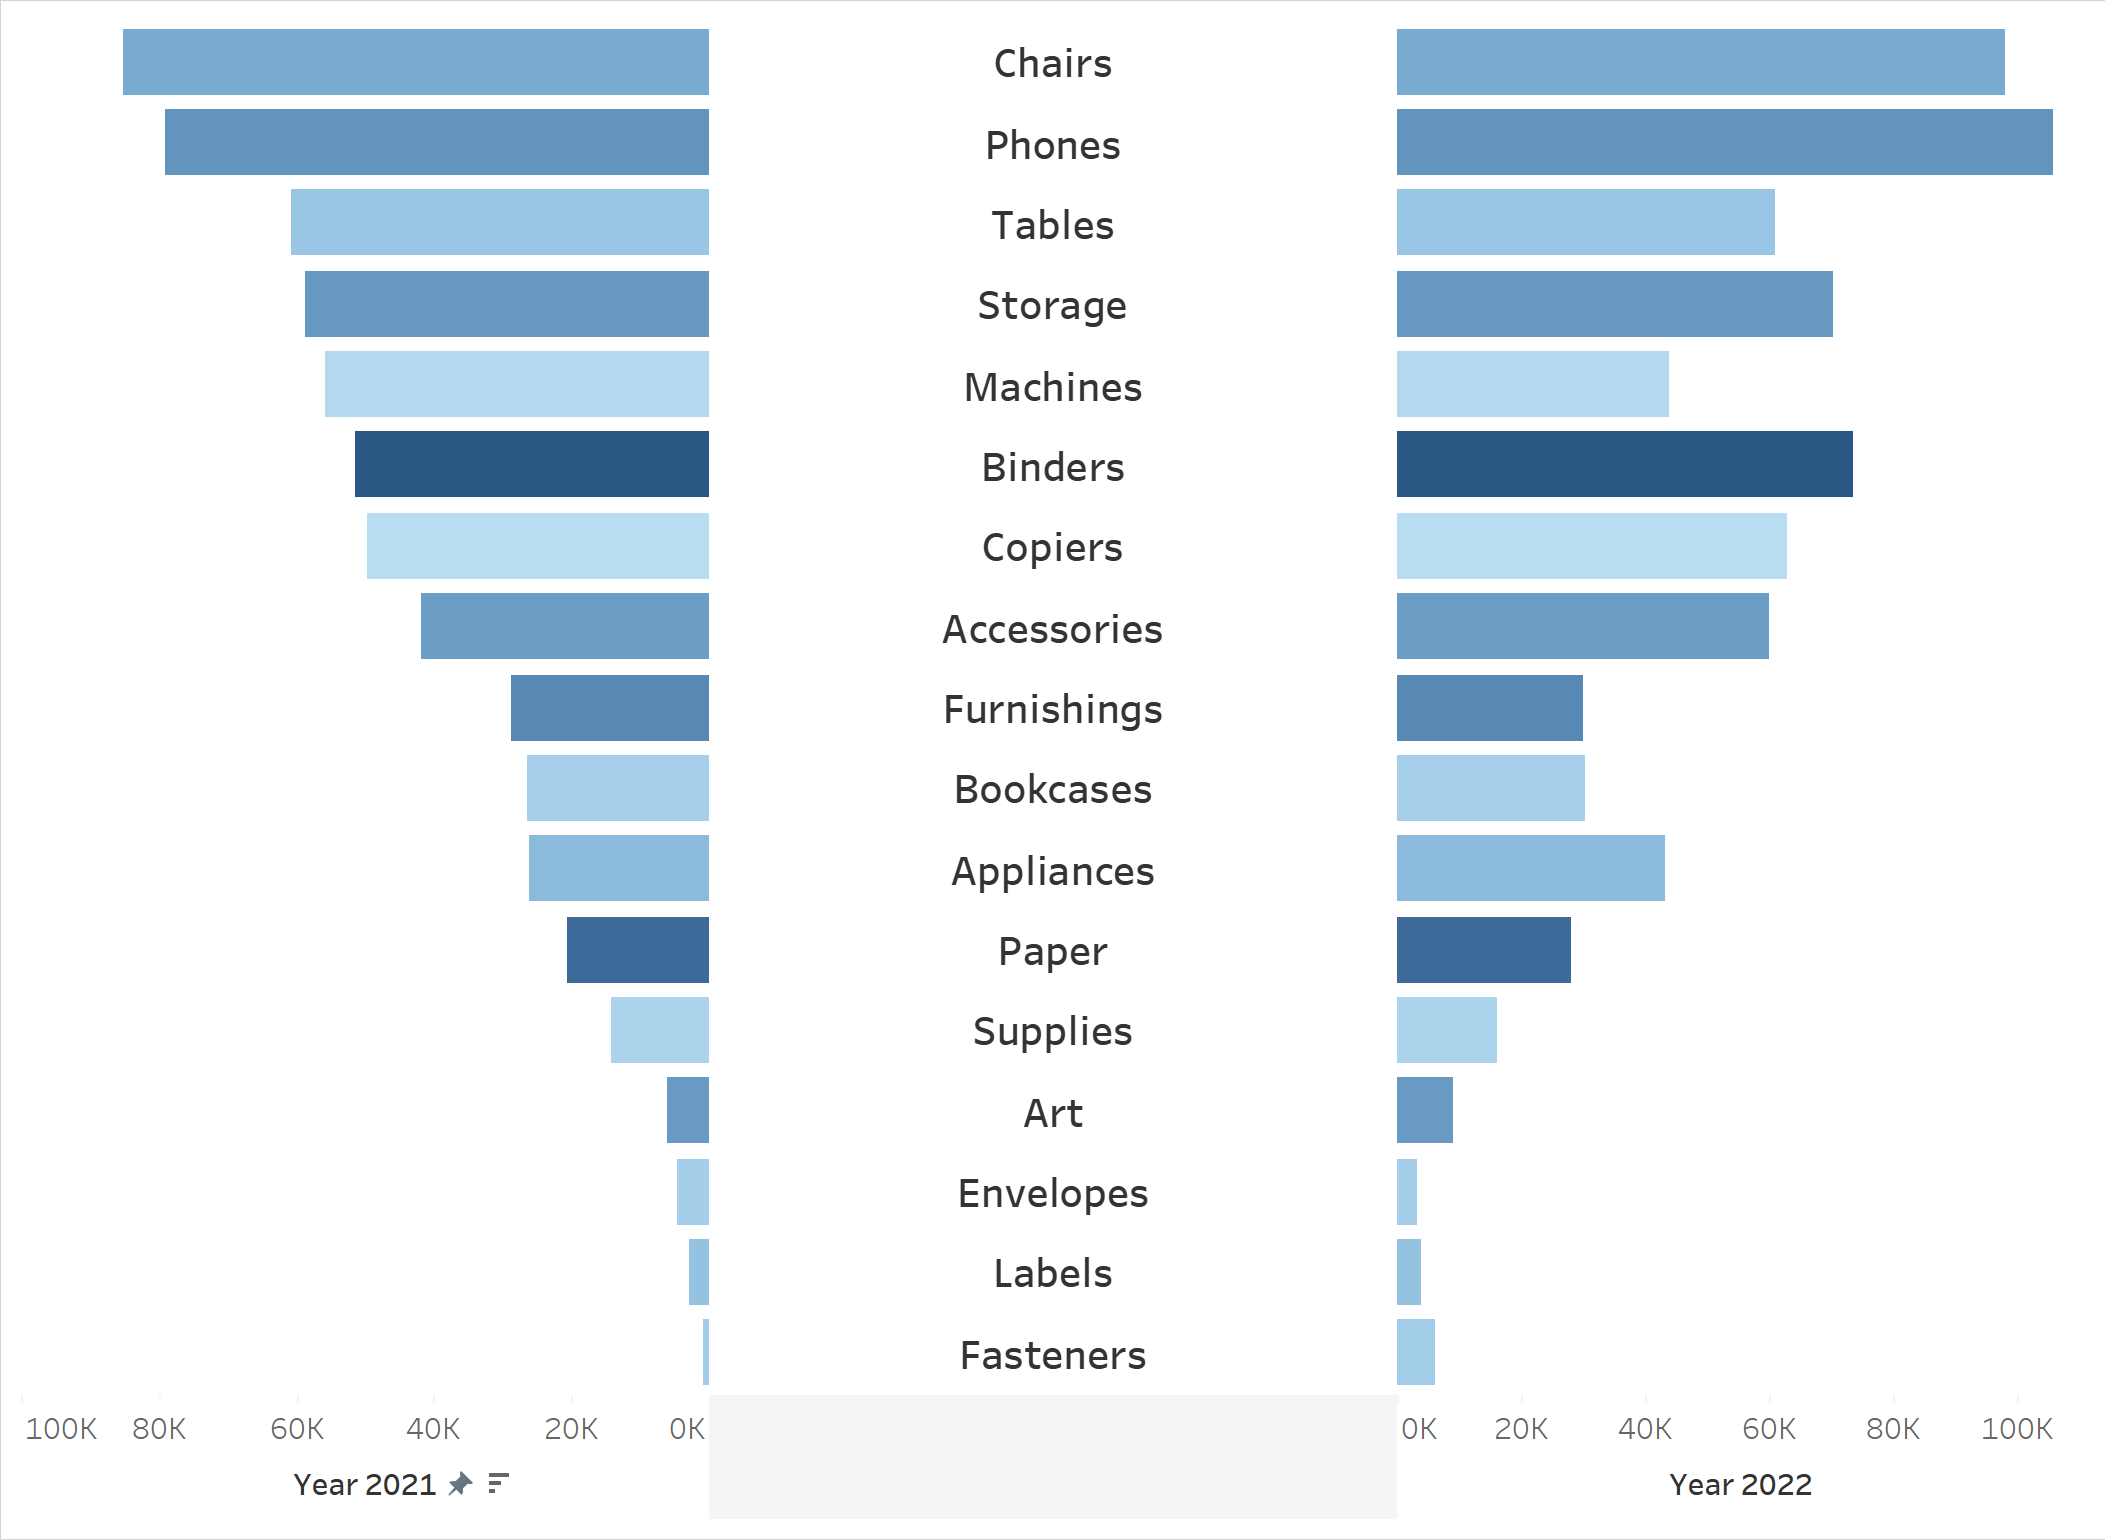
In this blog I am going to be covering how to create a butterfly chart (like the one below). I will be using the sample superstore data set.
Let's start!
Step 1: Create calculated fields.
In this butterfly chart we want to compare the 2021 sales to the 2022 sales. In order to do this, we need to create two calculated fields one looking at the sales in 2021 and the other one looking at 2022.
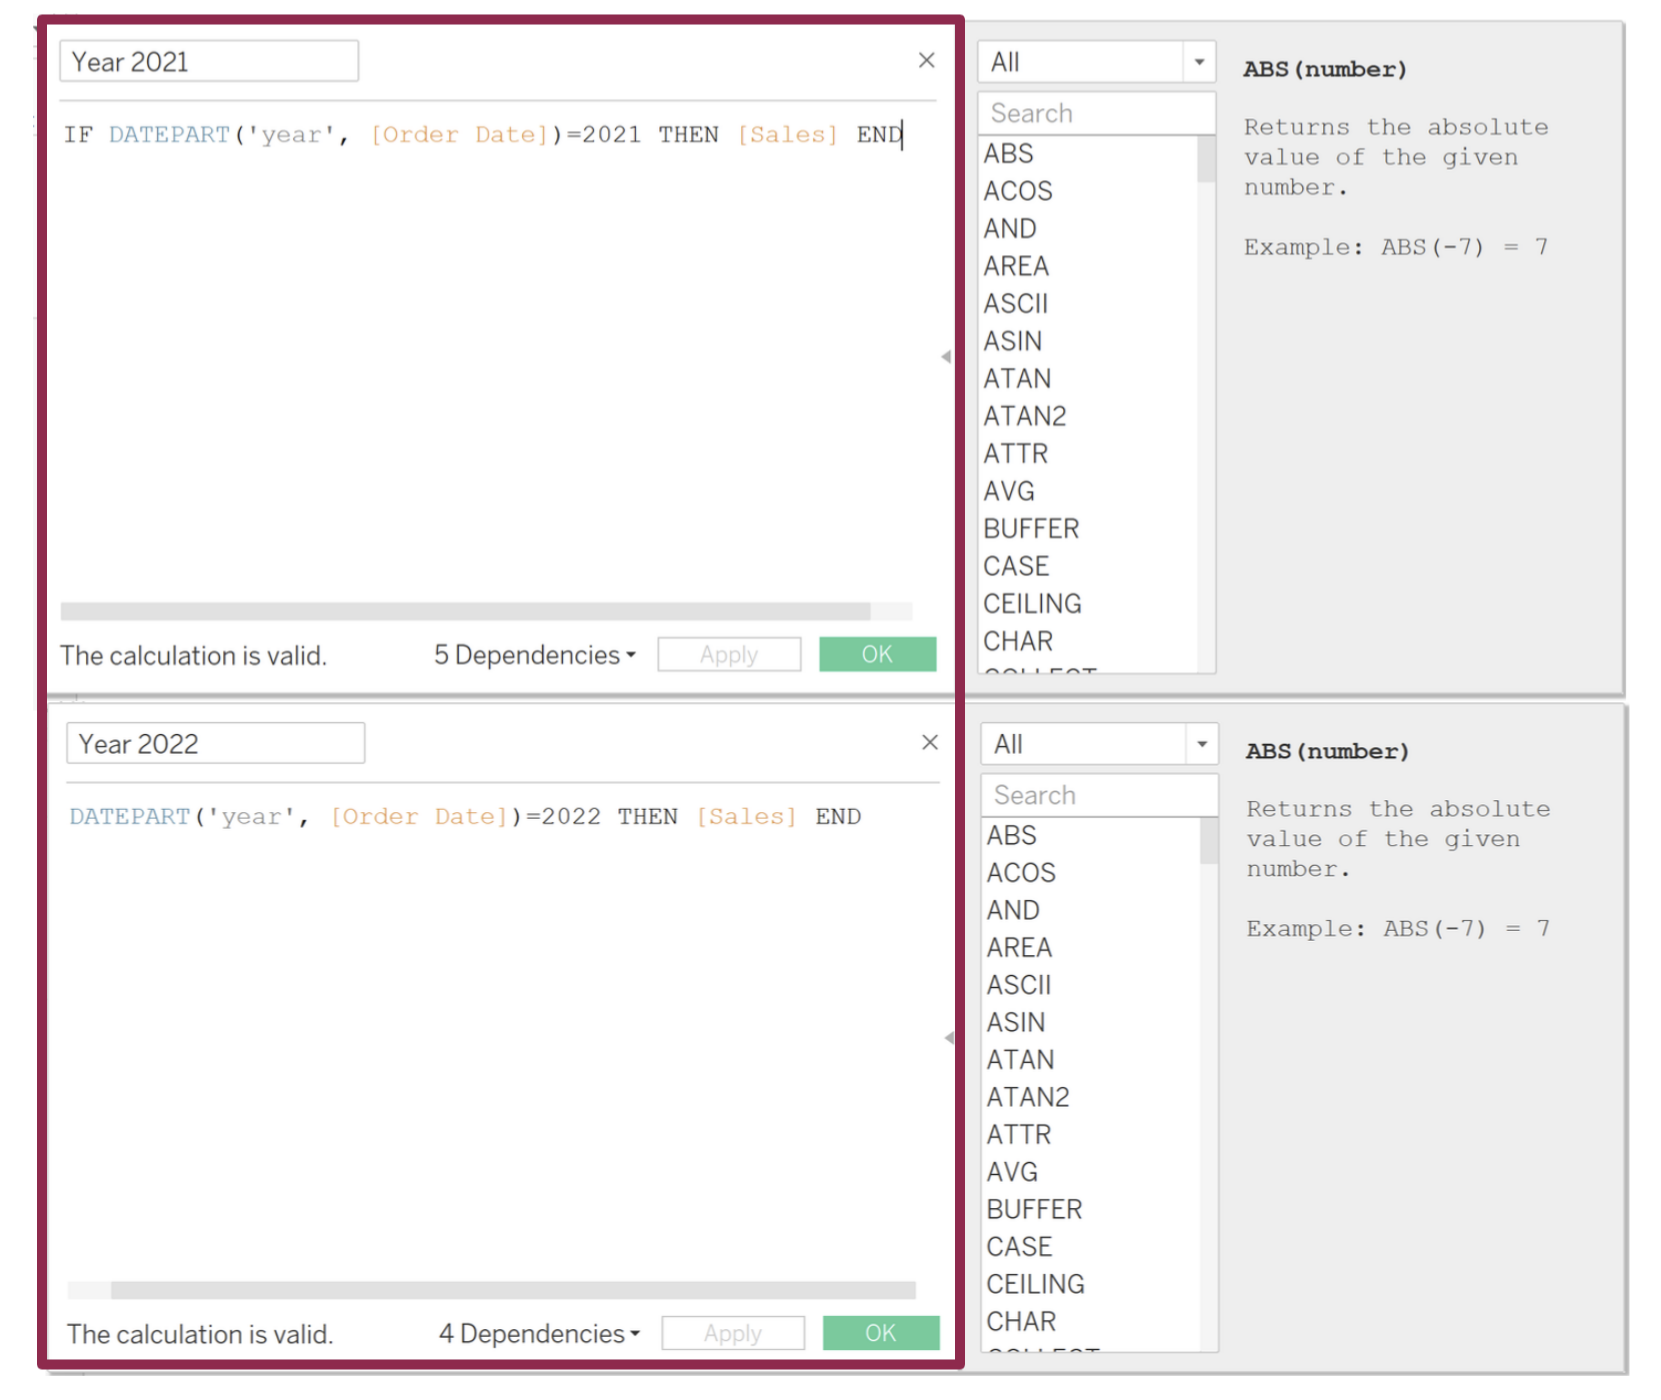
In the first calculation called 'Year 2021' we are going to input the following calculation: IF DATEPART('year', [Order Date])=2021 THEN [Sales] END
The calculation is basically saying find the sales in the order date where the year is 2021.
Once you have created the calculated field for 2021, you want simple duplicate that calculation by right clicking the calculation and selecting duplicate.
Once duplicated, right click again and select edit, we are going to call this calculation 'Year 2022' and replace the 2021 in the calculation with 2022.
Step 2.
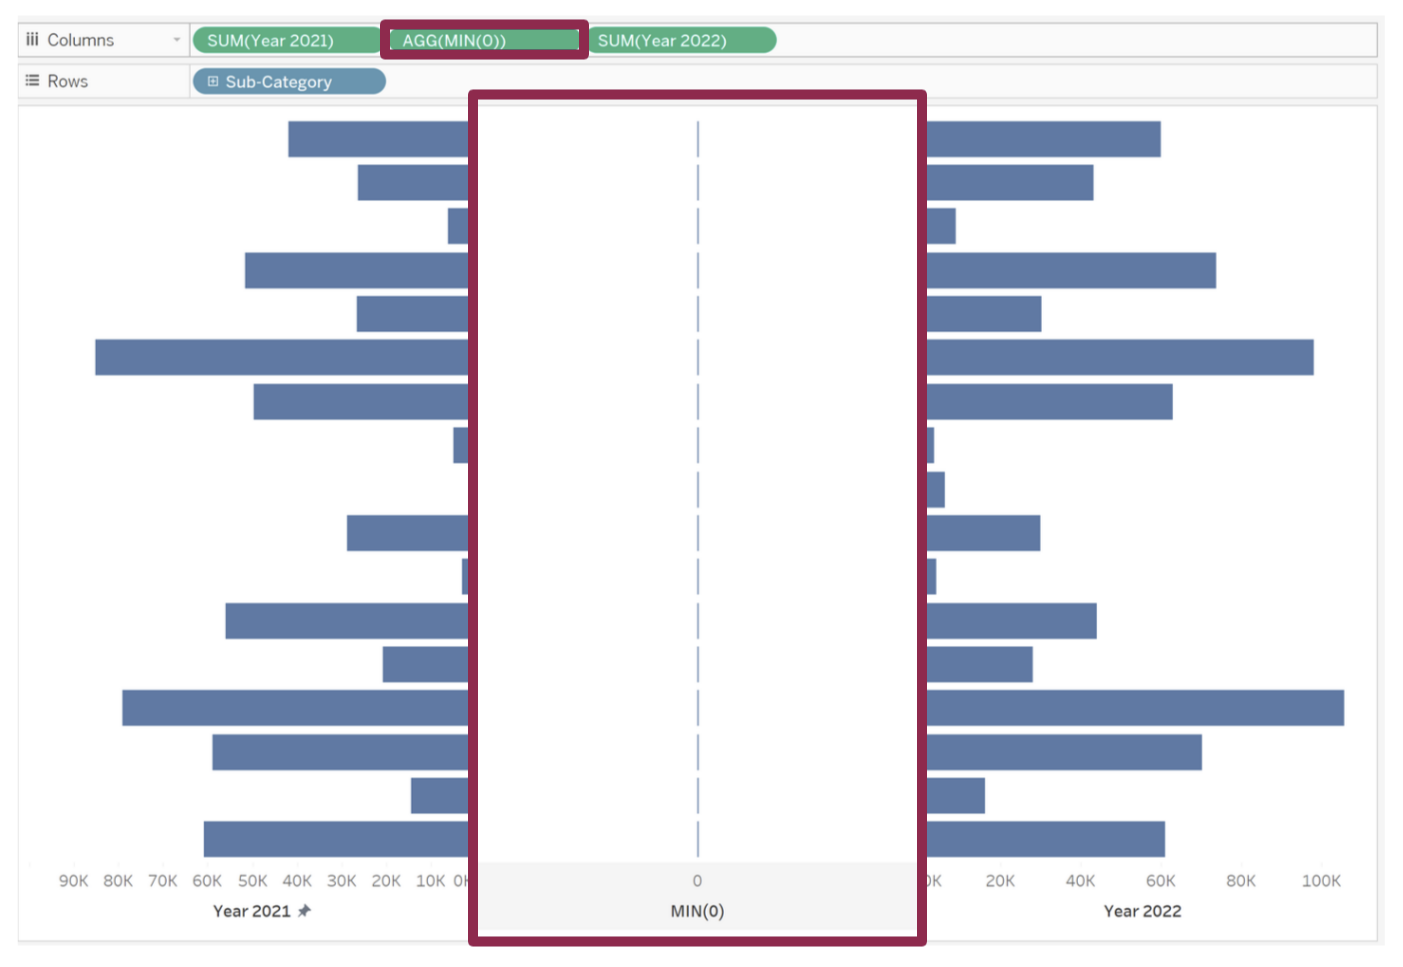
Drag and drop 'Year 2021 and Year 2022' to the columns and Sub-Category to the rows. Two charts should show up. To form the shape we want, we need to reverse the chart 'Year 2021'.
Right click the x-axis that says 'Year 2021' then select edit axis. Click the reverse box. The shape we want should form.
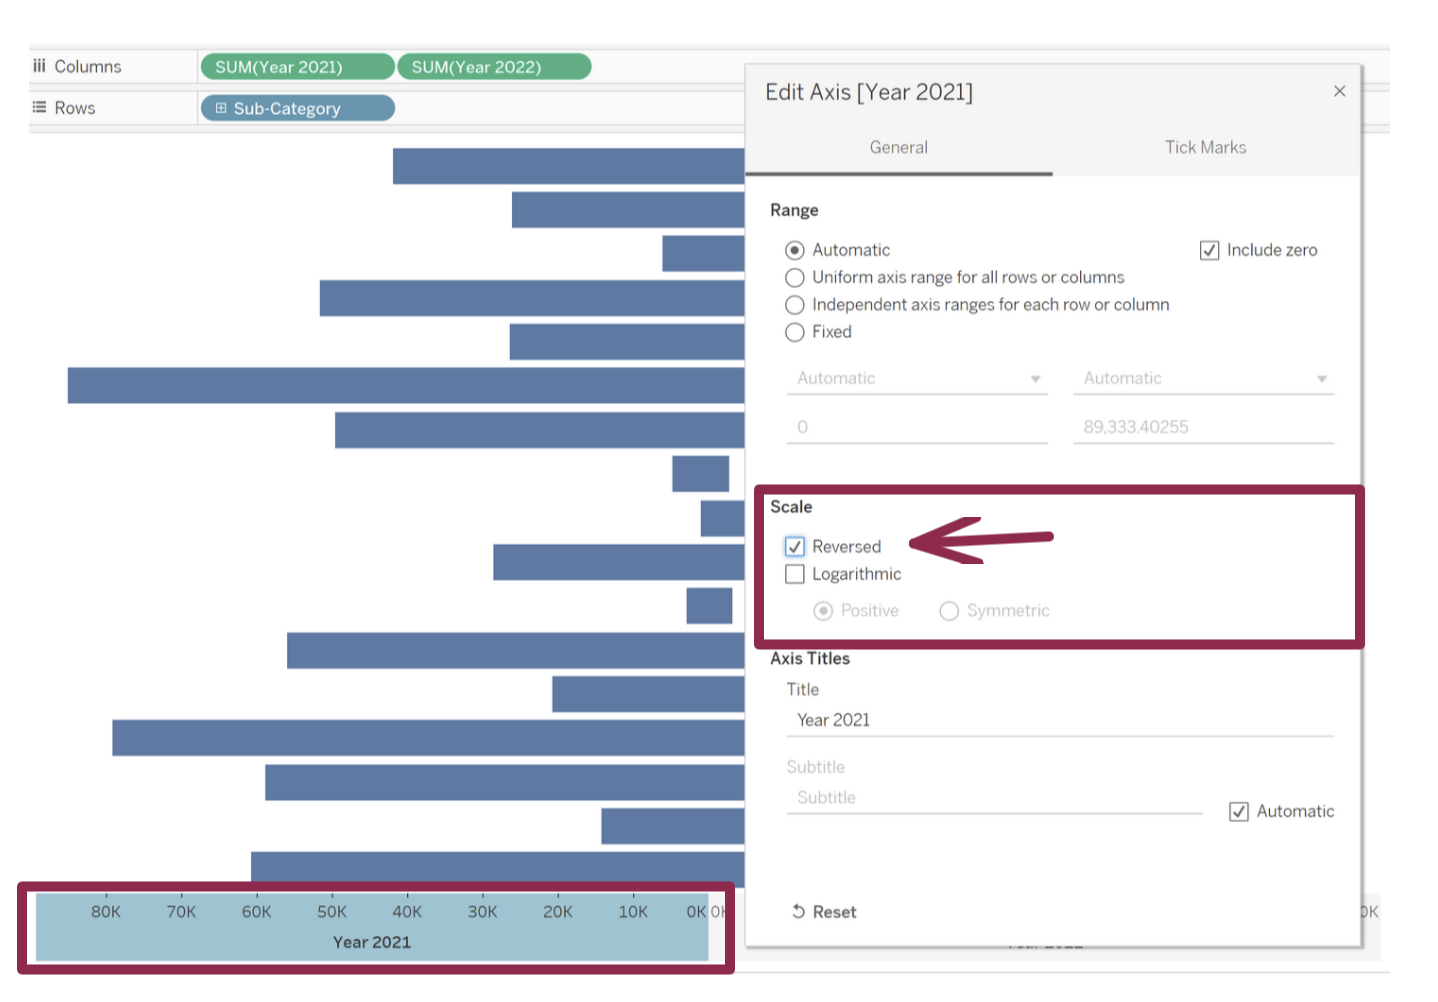
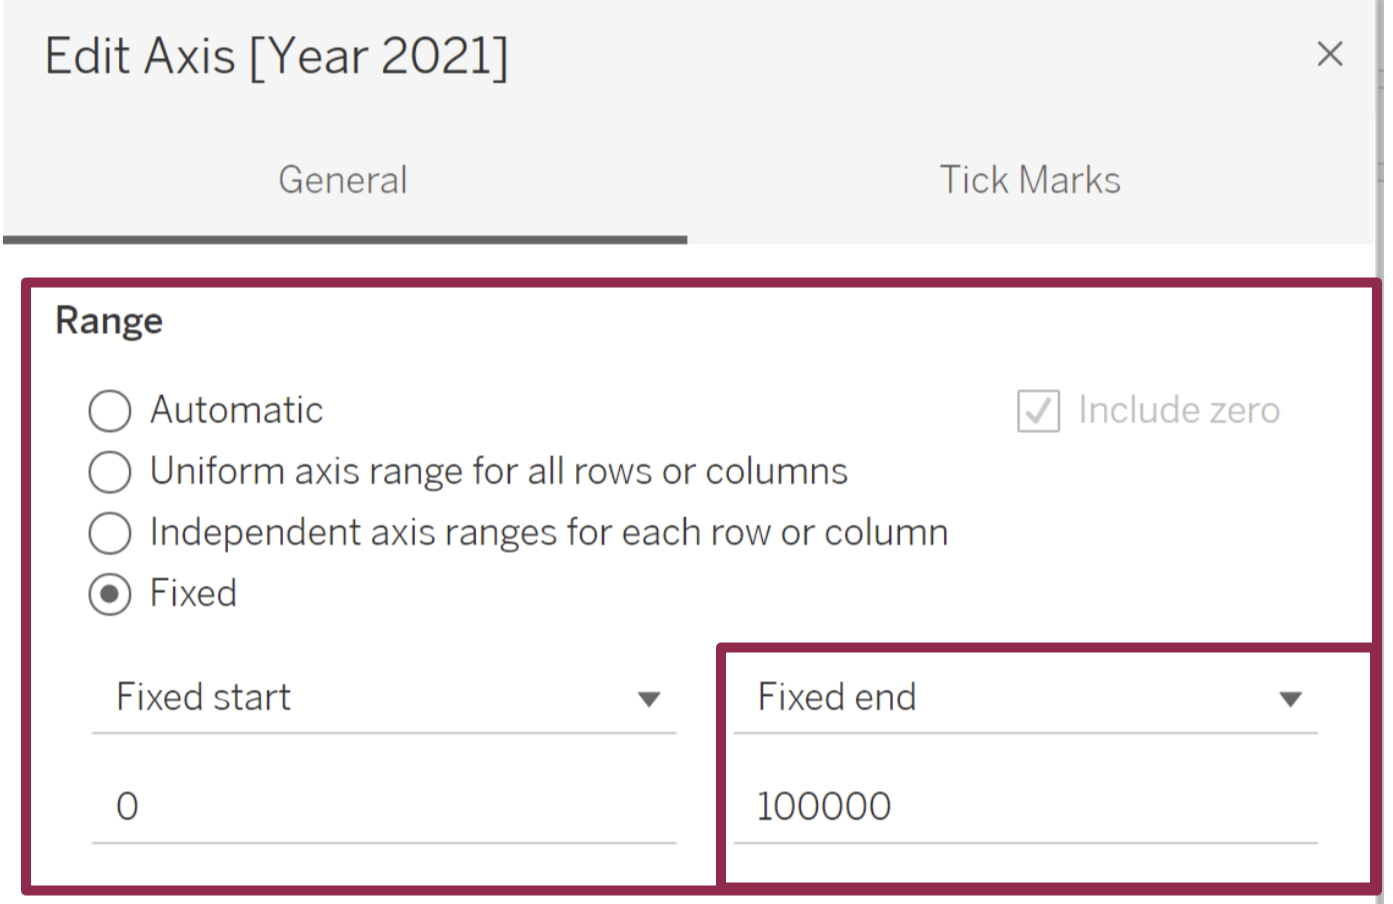
Whilst we are still in the Edit Axis [Year 2021] we are going to change the Range from 'Automatic' to Fixed, this is so that we can match the maximum value on the Year 2022 so that the bars look more proportional. So change the left handside to 100,000 like below.
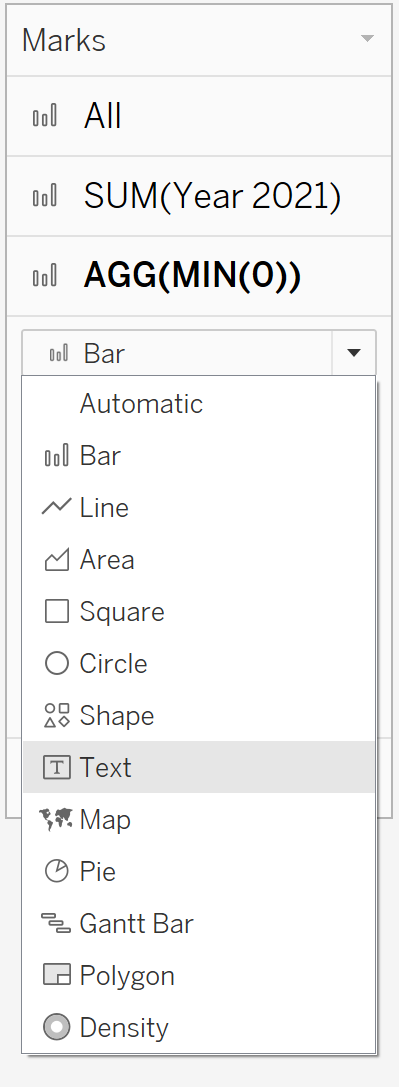
Step 3: Create a dummy field.
On the column shelf double click beside 'Year 2022' and type Min(0) click enter and drag that field in between 'Year 2021 and Year 2022' like below.
Now, go to the Marks column called AGG(MIN(0)) and change the mark type to Text. We can now drag and drop the sub category to the Labels on the Marks.
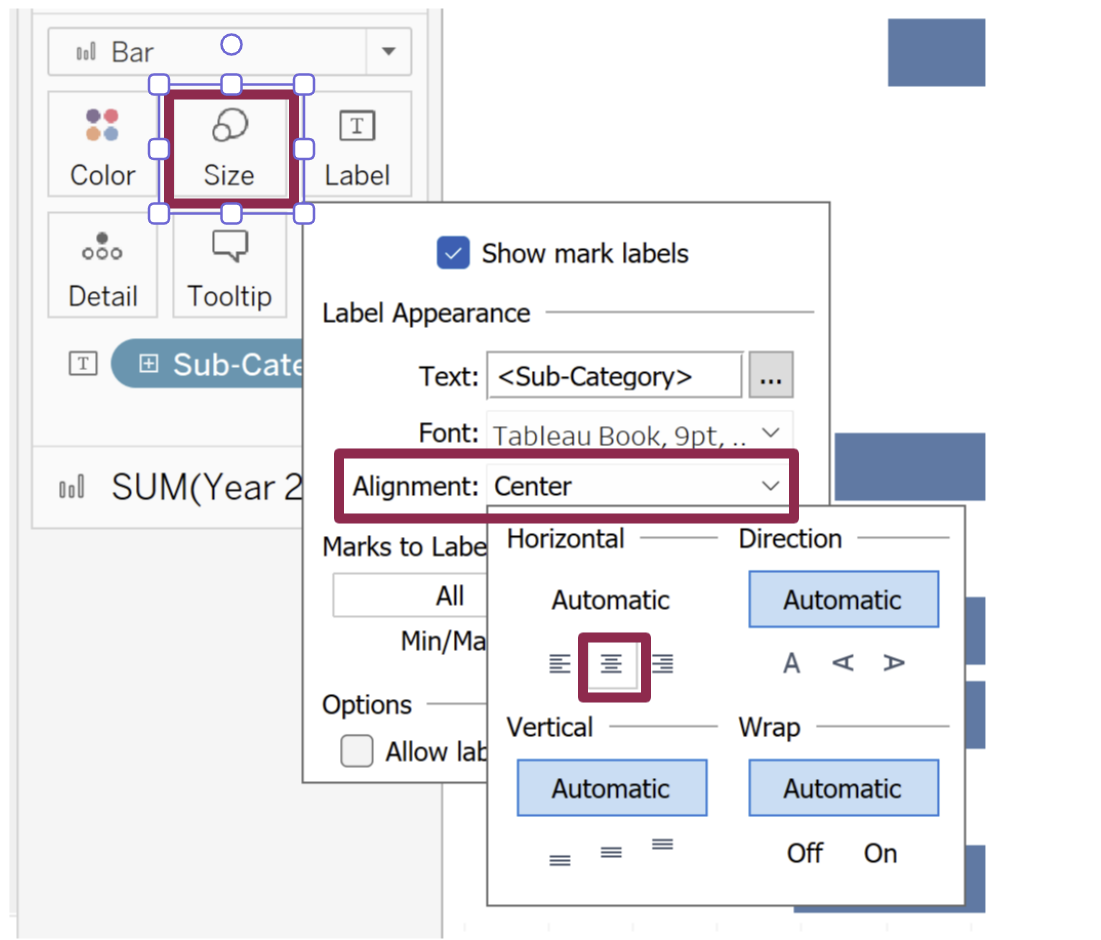
We are going to do a little bit of formating. Click Label then Alignment and select centre, the names of the Sub-Categories should now be in the middle. Now go to size and move the size toggle all the way to the left.
Last Step.
Select the Marks called All and Drag Quantity to colour and go to the top middle of the screen you should find the sort tool click on the biggest to smallest one.
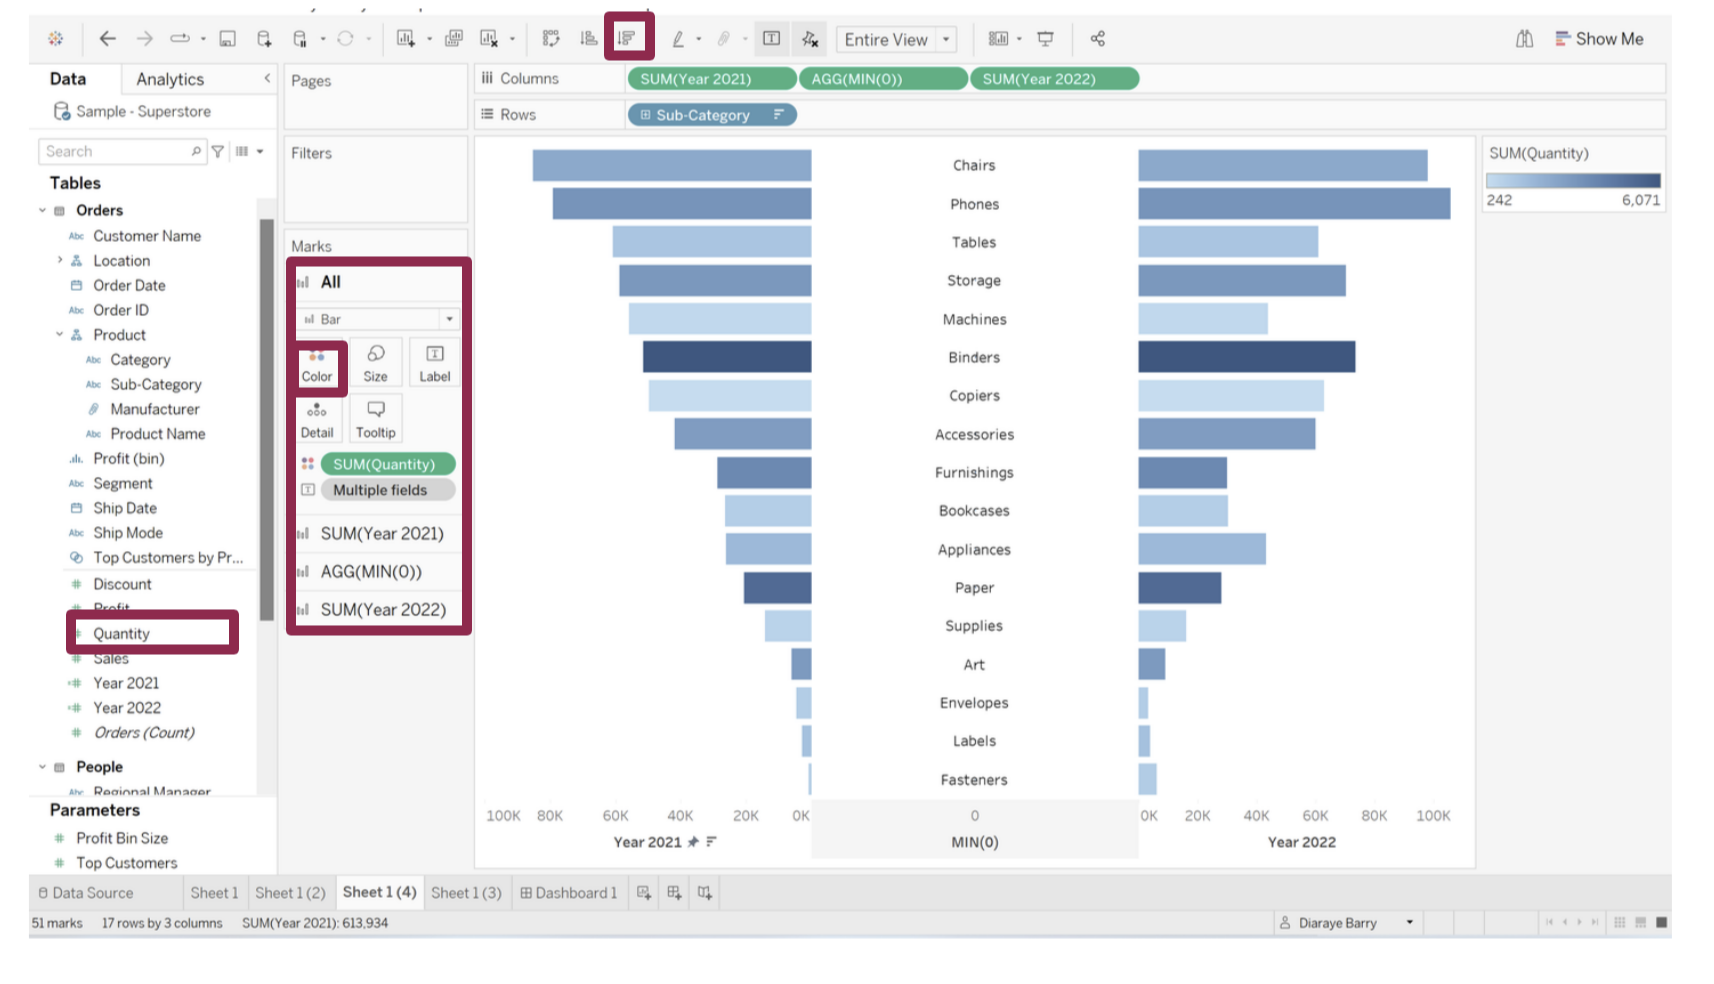
And that is it, all done!