This blog is going to look at two things I would do differently if I was to redo my data school application. The content of this blog will be based on my first application.
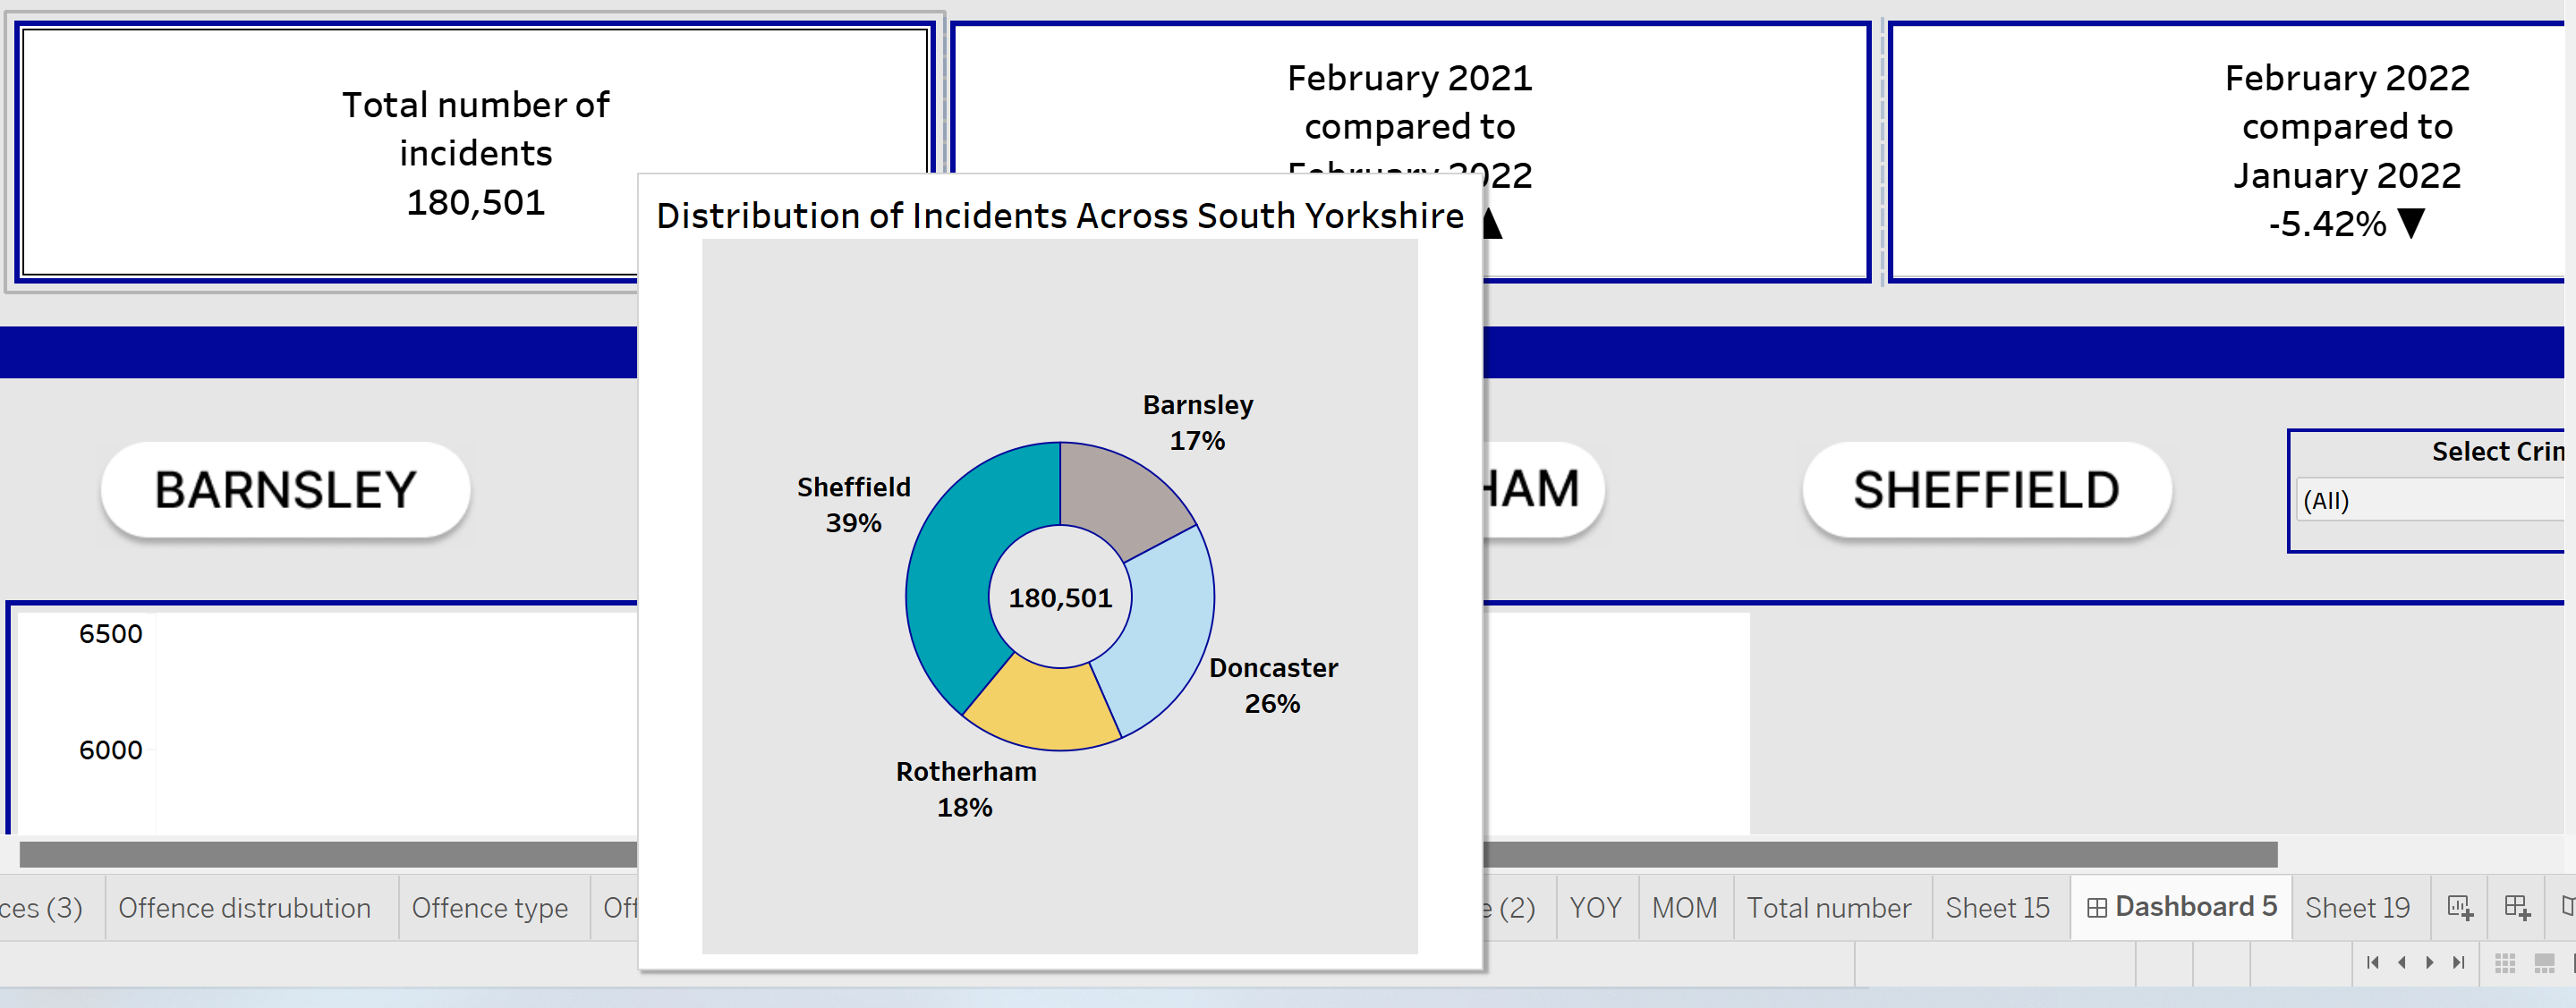
My first dashboard was based on crime statistics of South Yorkshire.
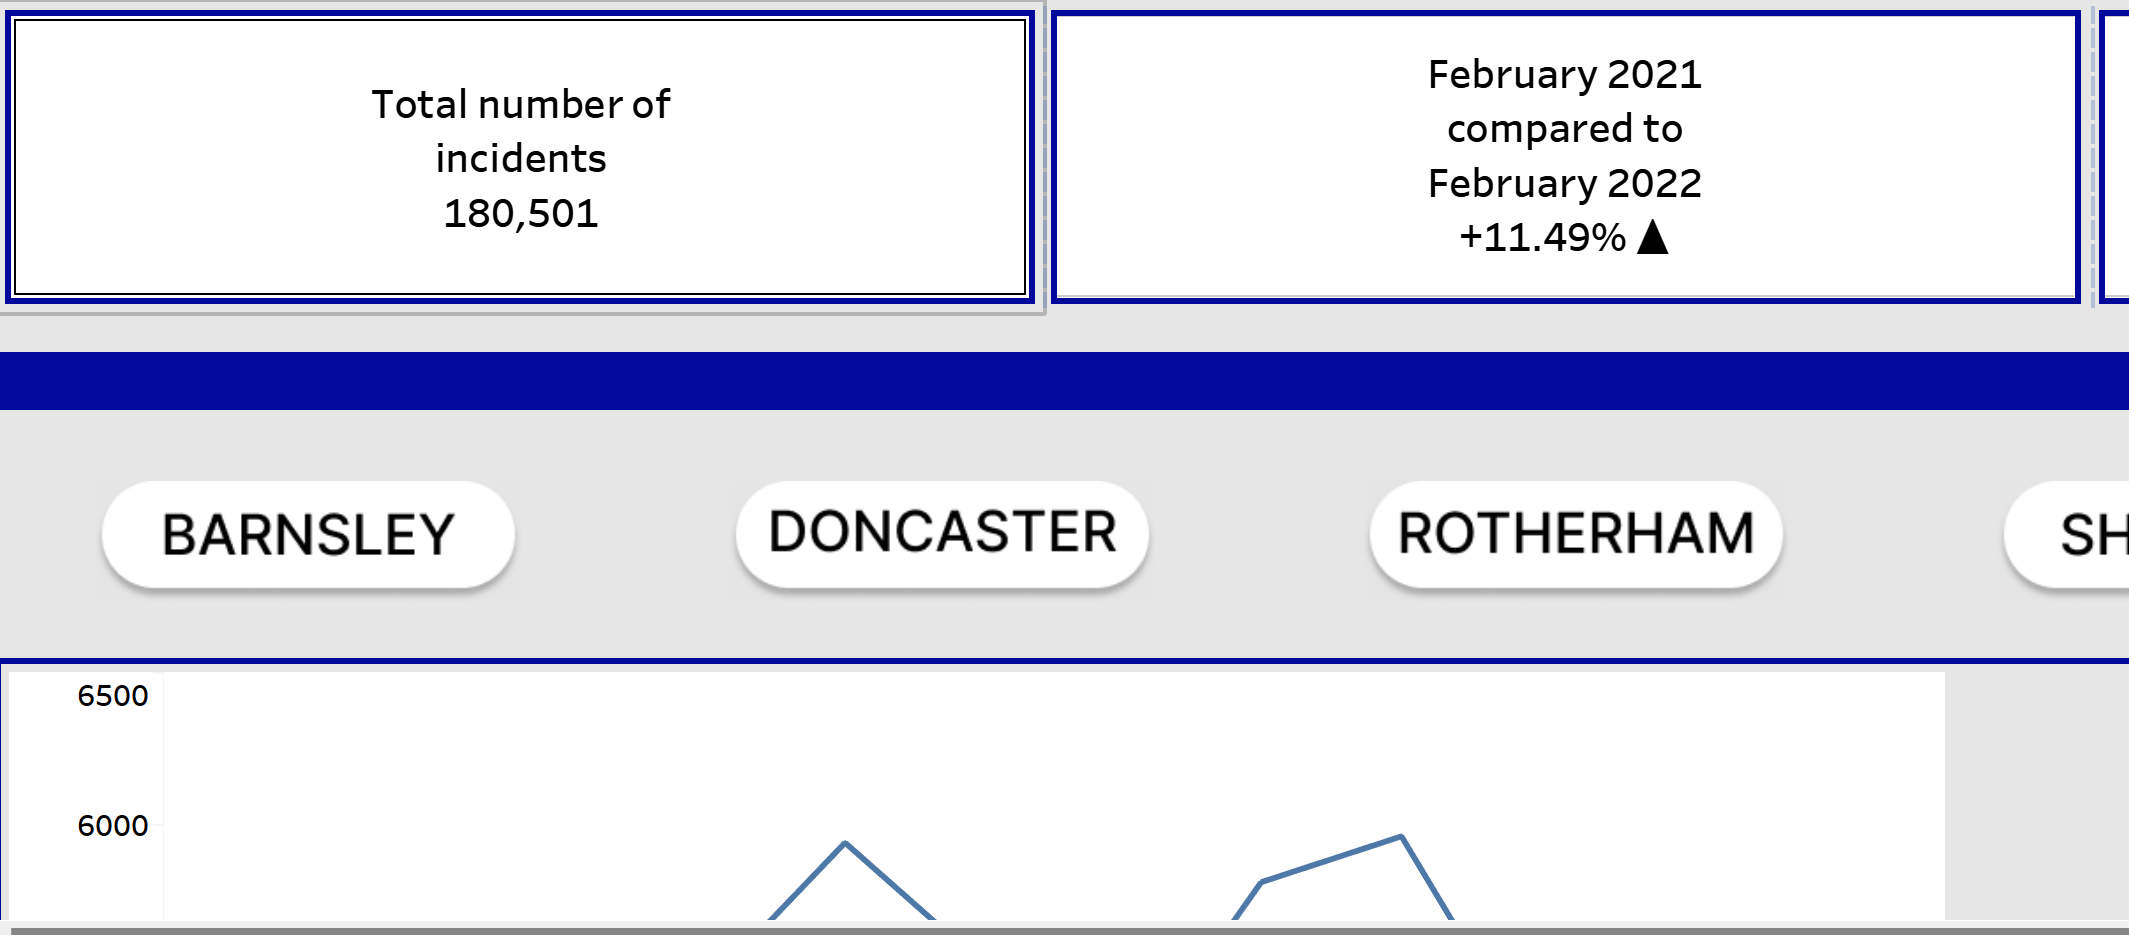
First: For my application I compared the crime statistics of Sheffield, Doncaster, Rotherham and Barnsley.
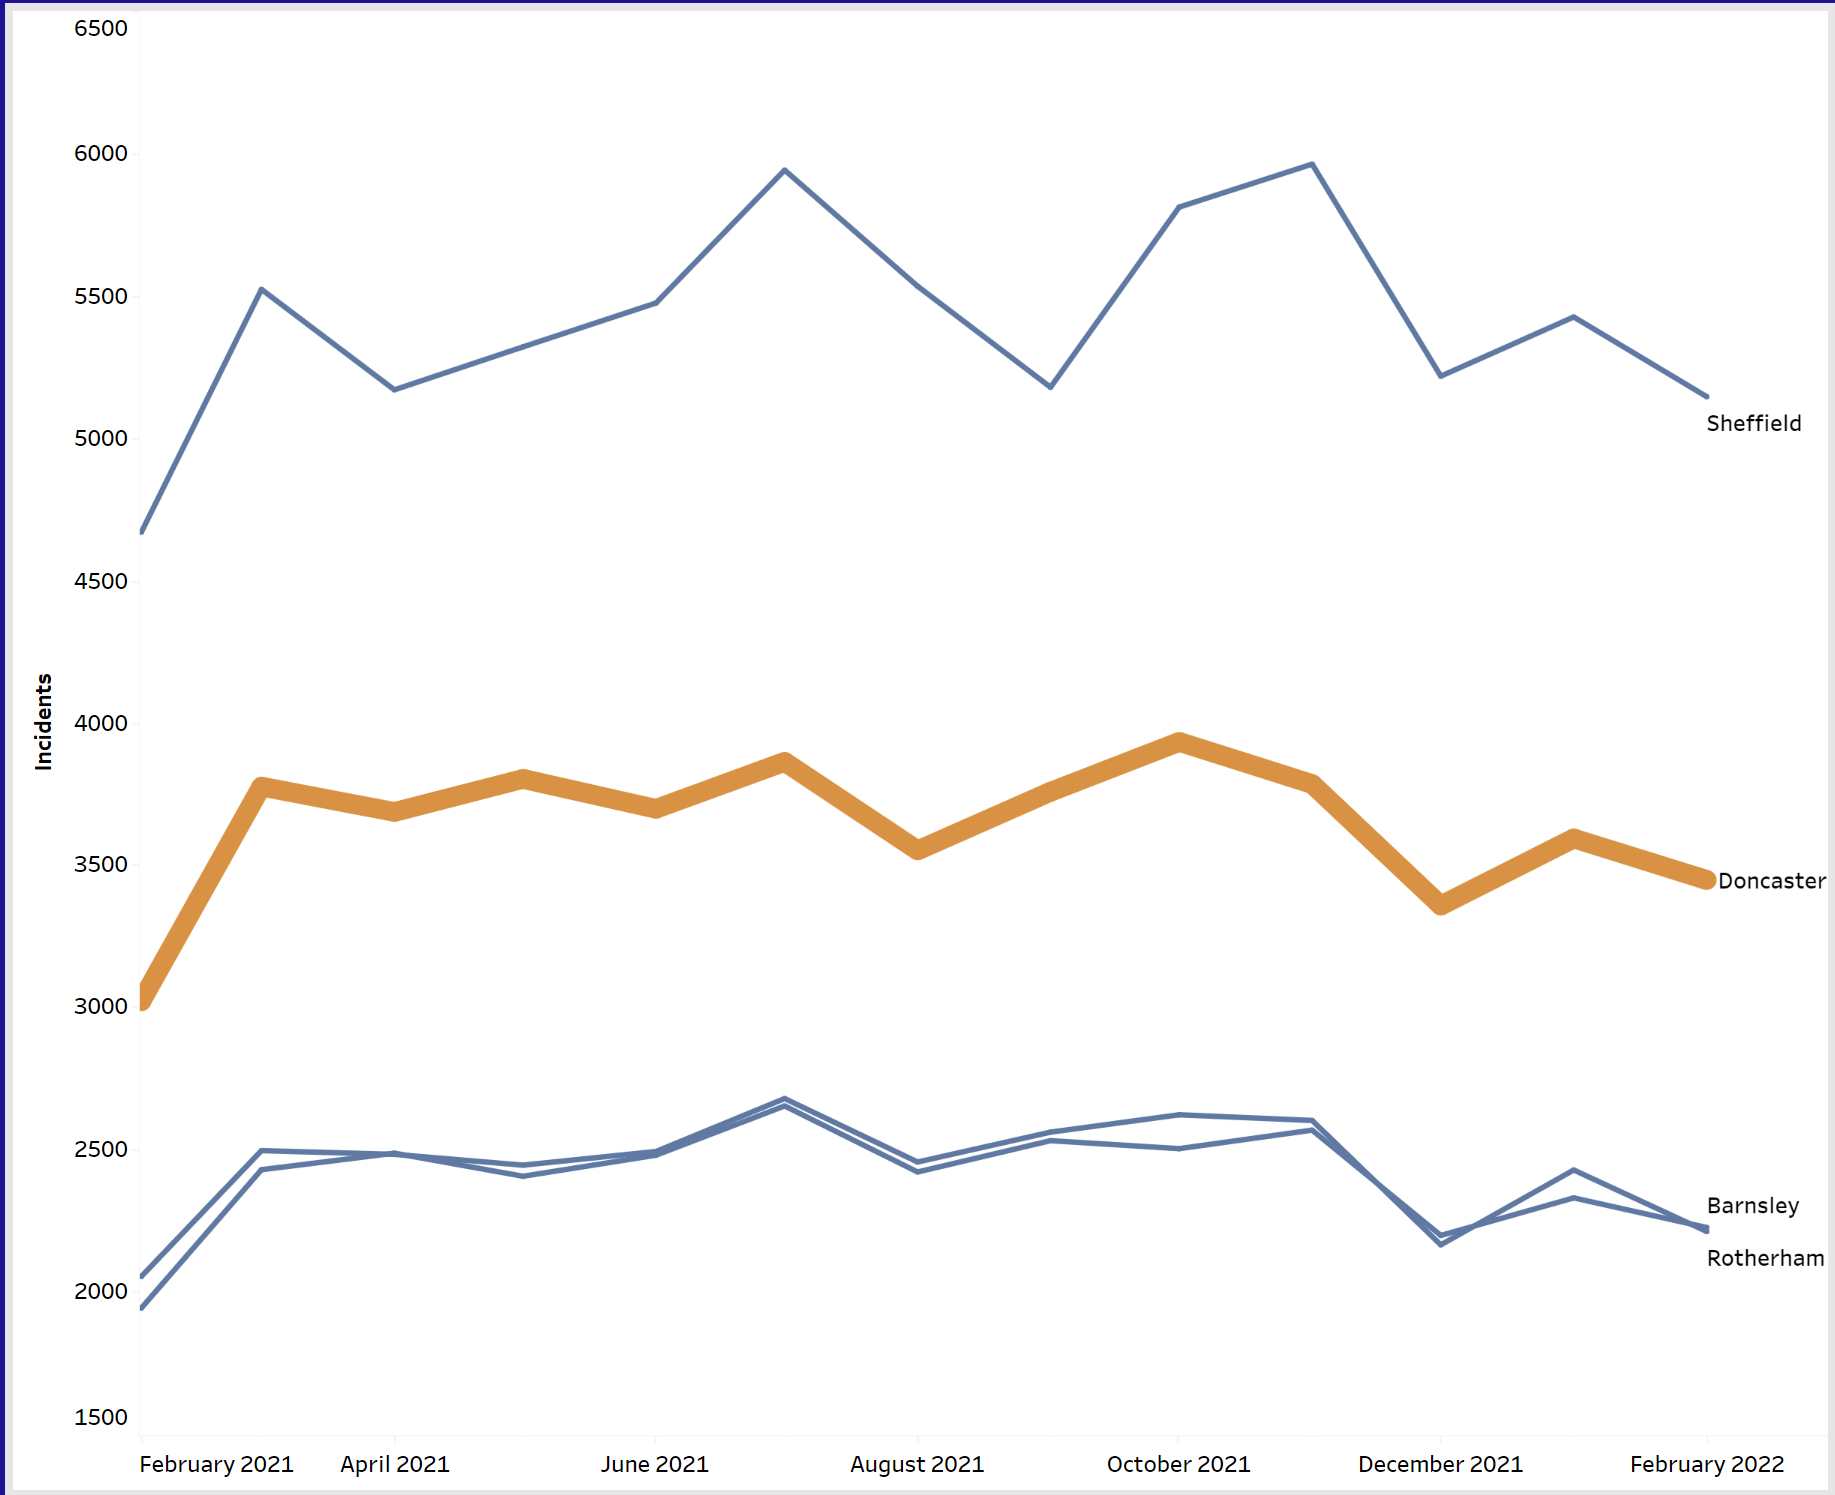
Sheffield showed the highest rate, but this could be because Sheffield has a higher population than the rest of the boroughs. So, what I would do differently is account for population by normalising the data. Here is how to do it if the population data is not already in the data set.
Step 1:
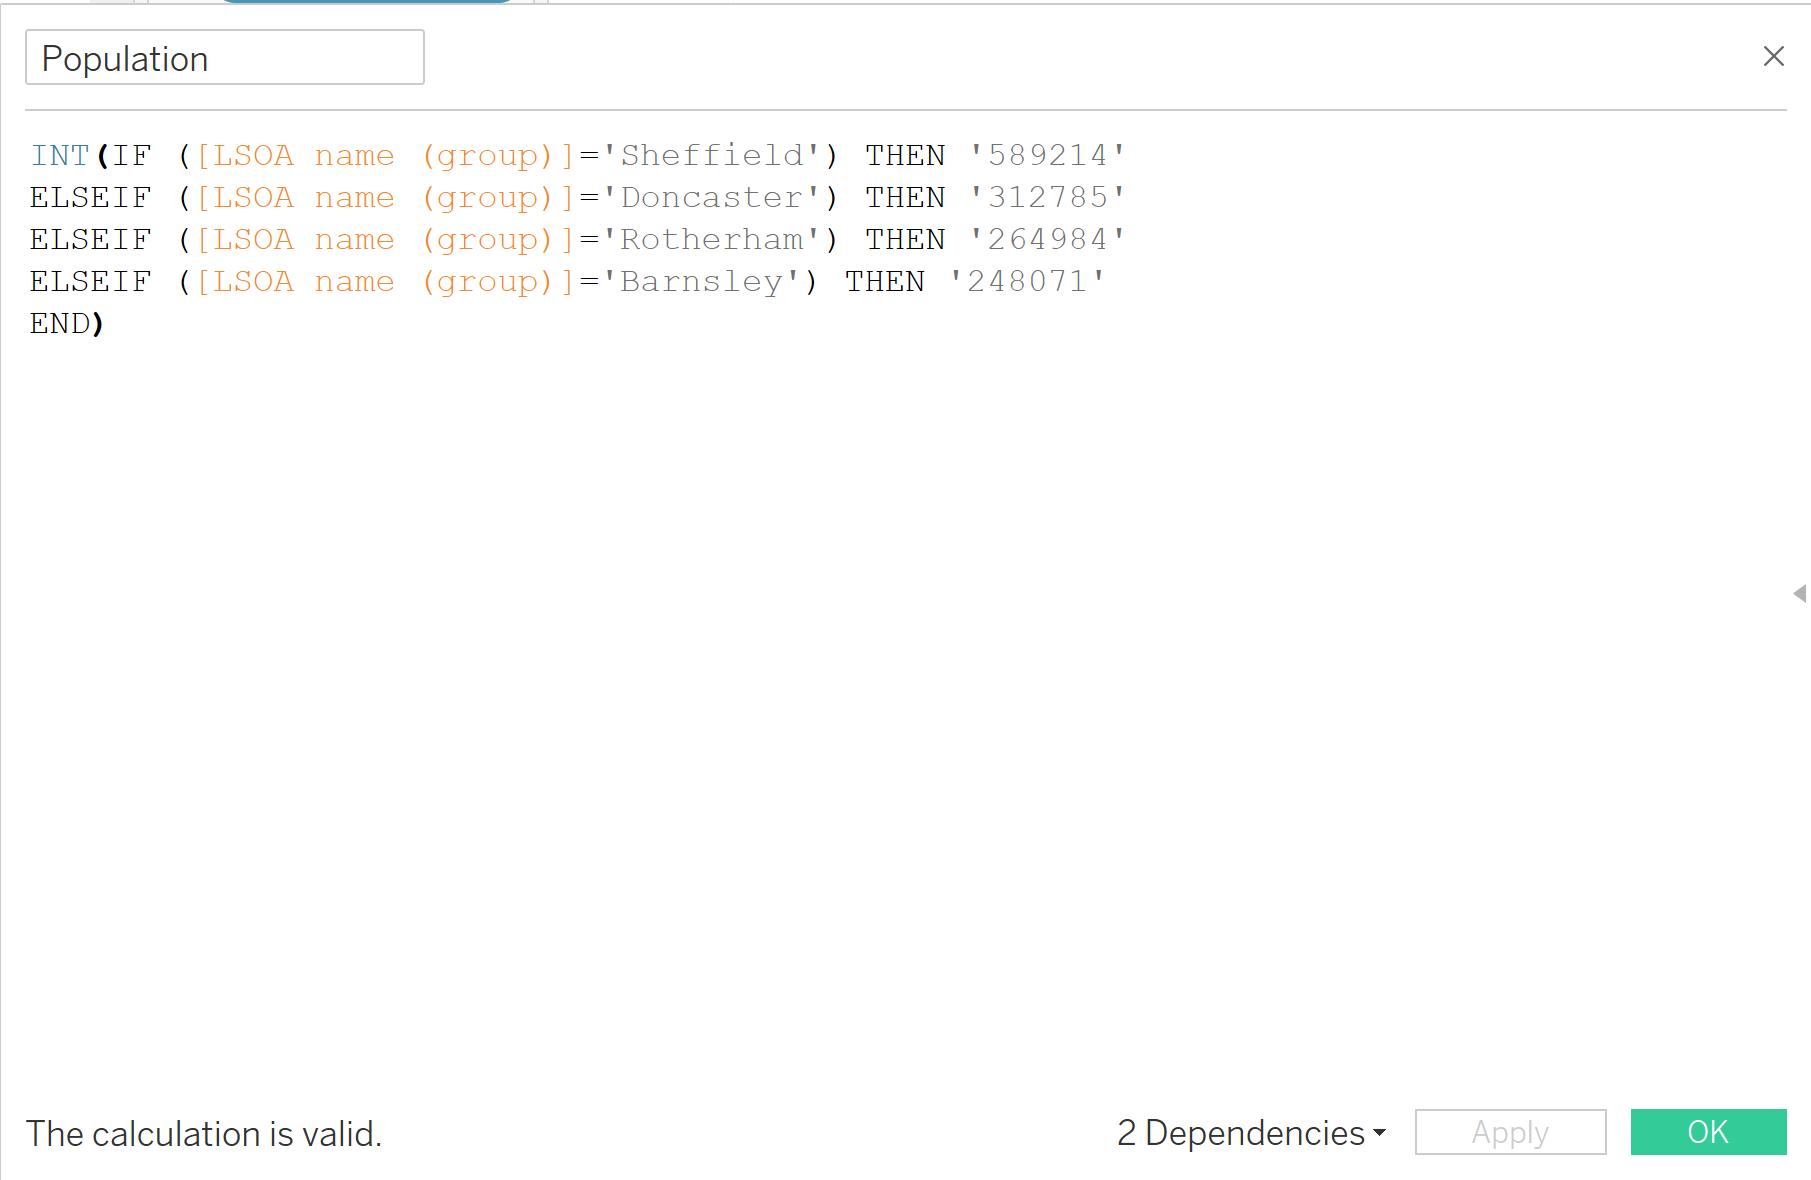
Create a calculated field and title it population.
Create an IF statement that contains the population value like below.
Step 2:
Create another calculated field. This time we are dividing Crime/Population
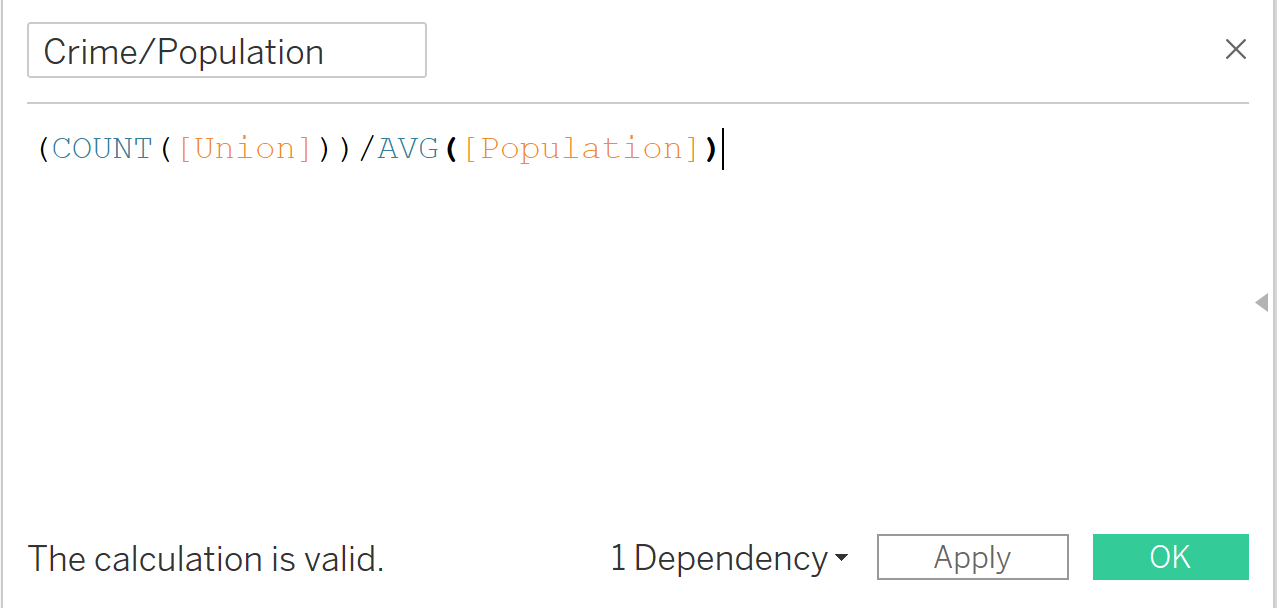
Population must be turn into an average like above, this is because [Population] the way it currently is does row level calculation ( adding the population value to every single row), by doing the average it divides by the number of times it appears therefore showing the actual value.
Step 3
Drag the Crime/Population field you created into the row column and that is it.
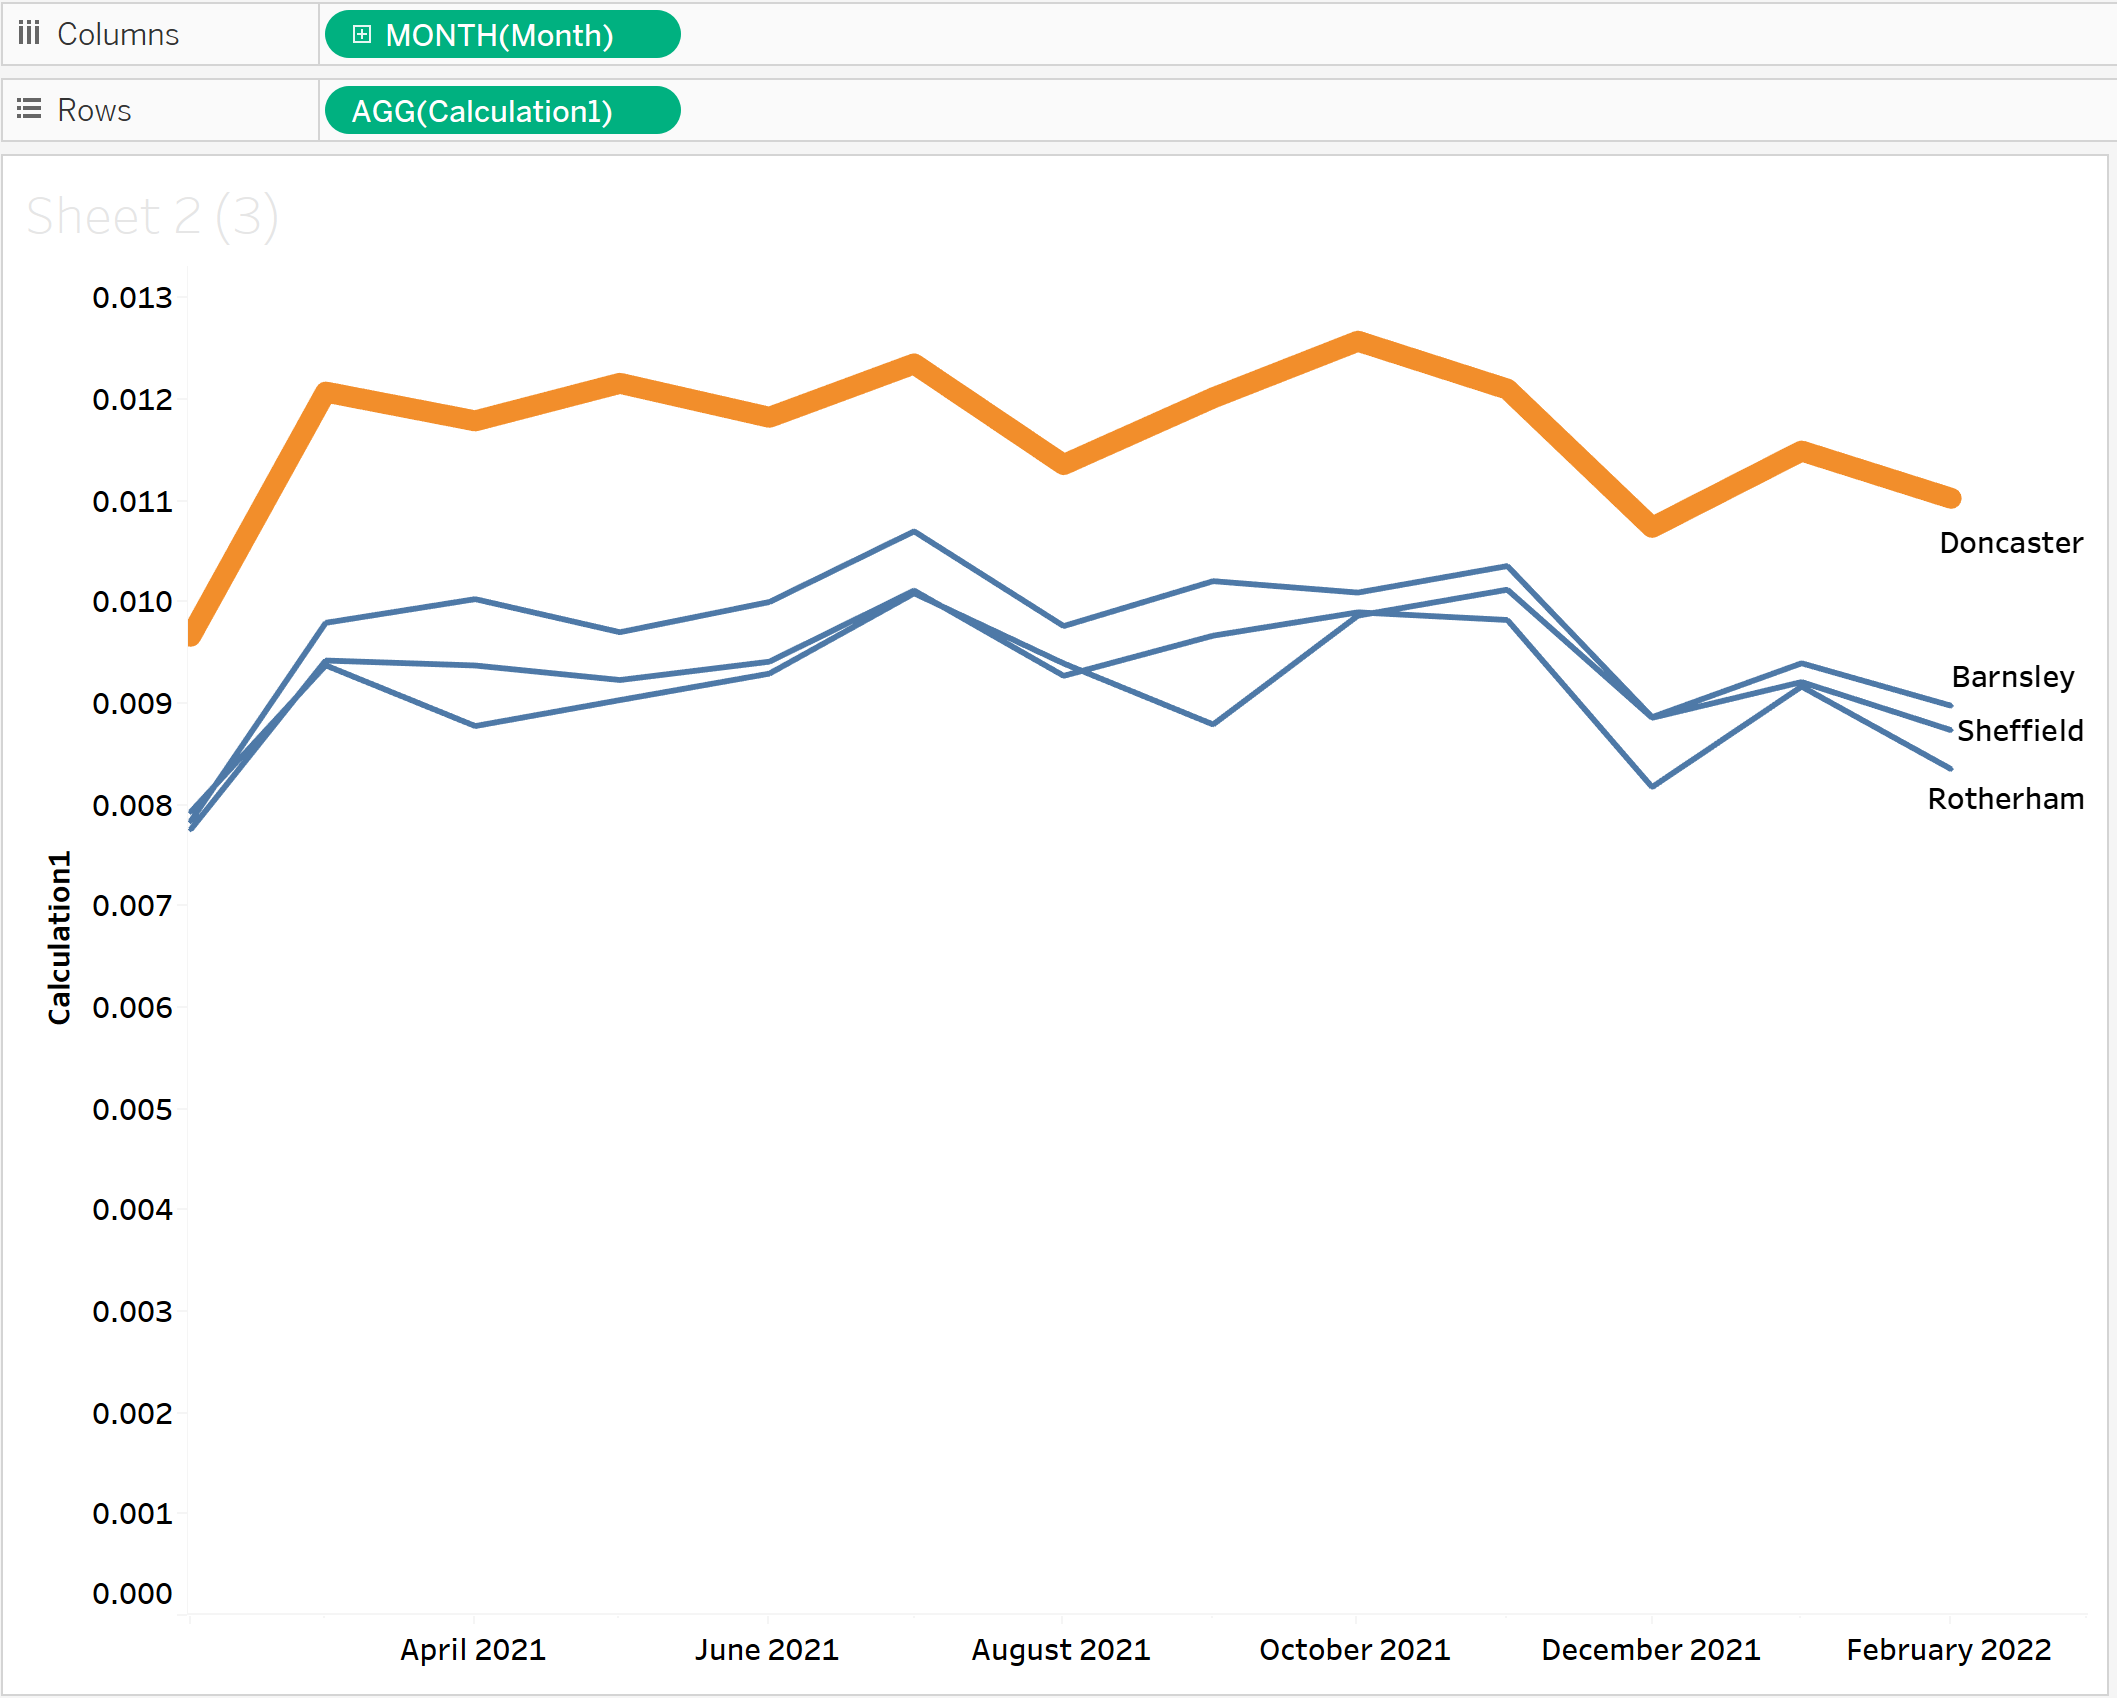
Unlike before Sheffield no longer has the highest rate 0f crime, after normalising the data, we can now see that Doncaster has more crime.
Second thing I would do different.
After presenting my first dashboard, I learned that Bans are not supposed to have tooltips. So, if I was to do this again I would remove the tooltips from my Bans.
Here is how to do that.
Step 1
Go to the sheet and click on the tooltip icon.
Step 2
Deselect show tooltip.
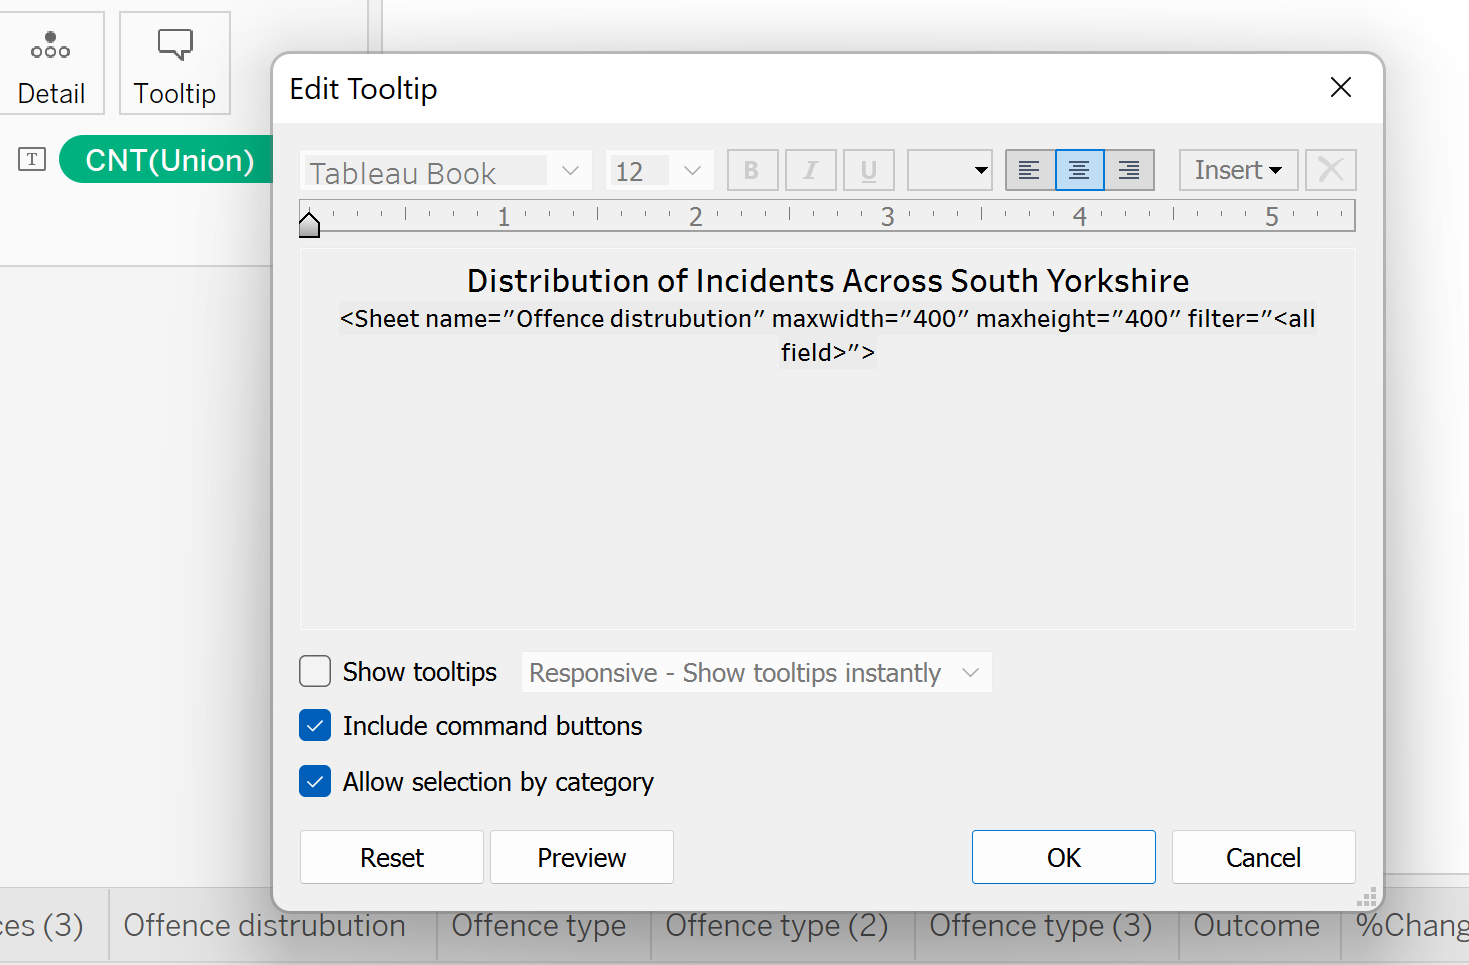
And that is it.