Today is day 3 of dashboard week. Today is KPI day. Today I learn about Rick and Morty. First of all, I know nothing about Rick and Morty, not only that, I have ZERO creativity. This all made today challenging.
The brief:
"Today’s challenge comes from Coach Robbin. He’s a huge Rick and Morty fan, knows the team neess more practice with APIs, and what's better than the Rick and Morty API. According to the website:
The Rick and Morty API (or ShlaAPI) is a RESTful API based on the television show Rick and Morty. You will have access to about hundreds of characters, images, locations and episodes. The Rick and Morty API is filled with canonical information as seen on the TV show."
My experience:
As I have already said, this was a very challenging day. I started of with calling the API, the character one. To be honest, thinking back I may have struggled because I didn't have any direction. I had no idea what I wanted to create. I spent 87% of my time of Alteryx trying to get data to recreate charts previously done, however that didn't go well.
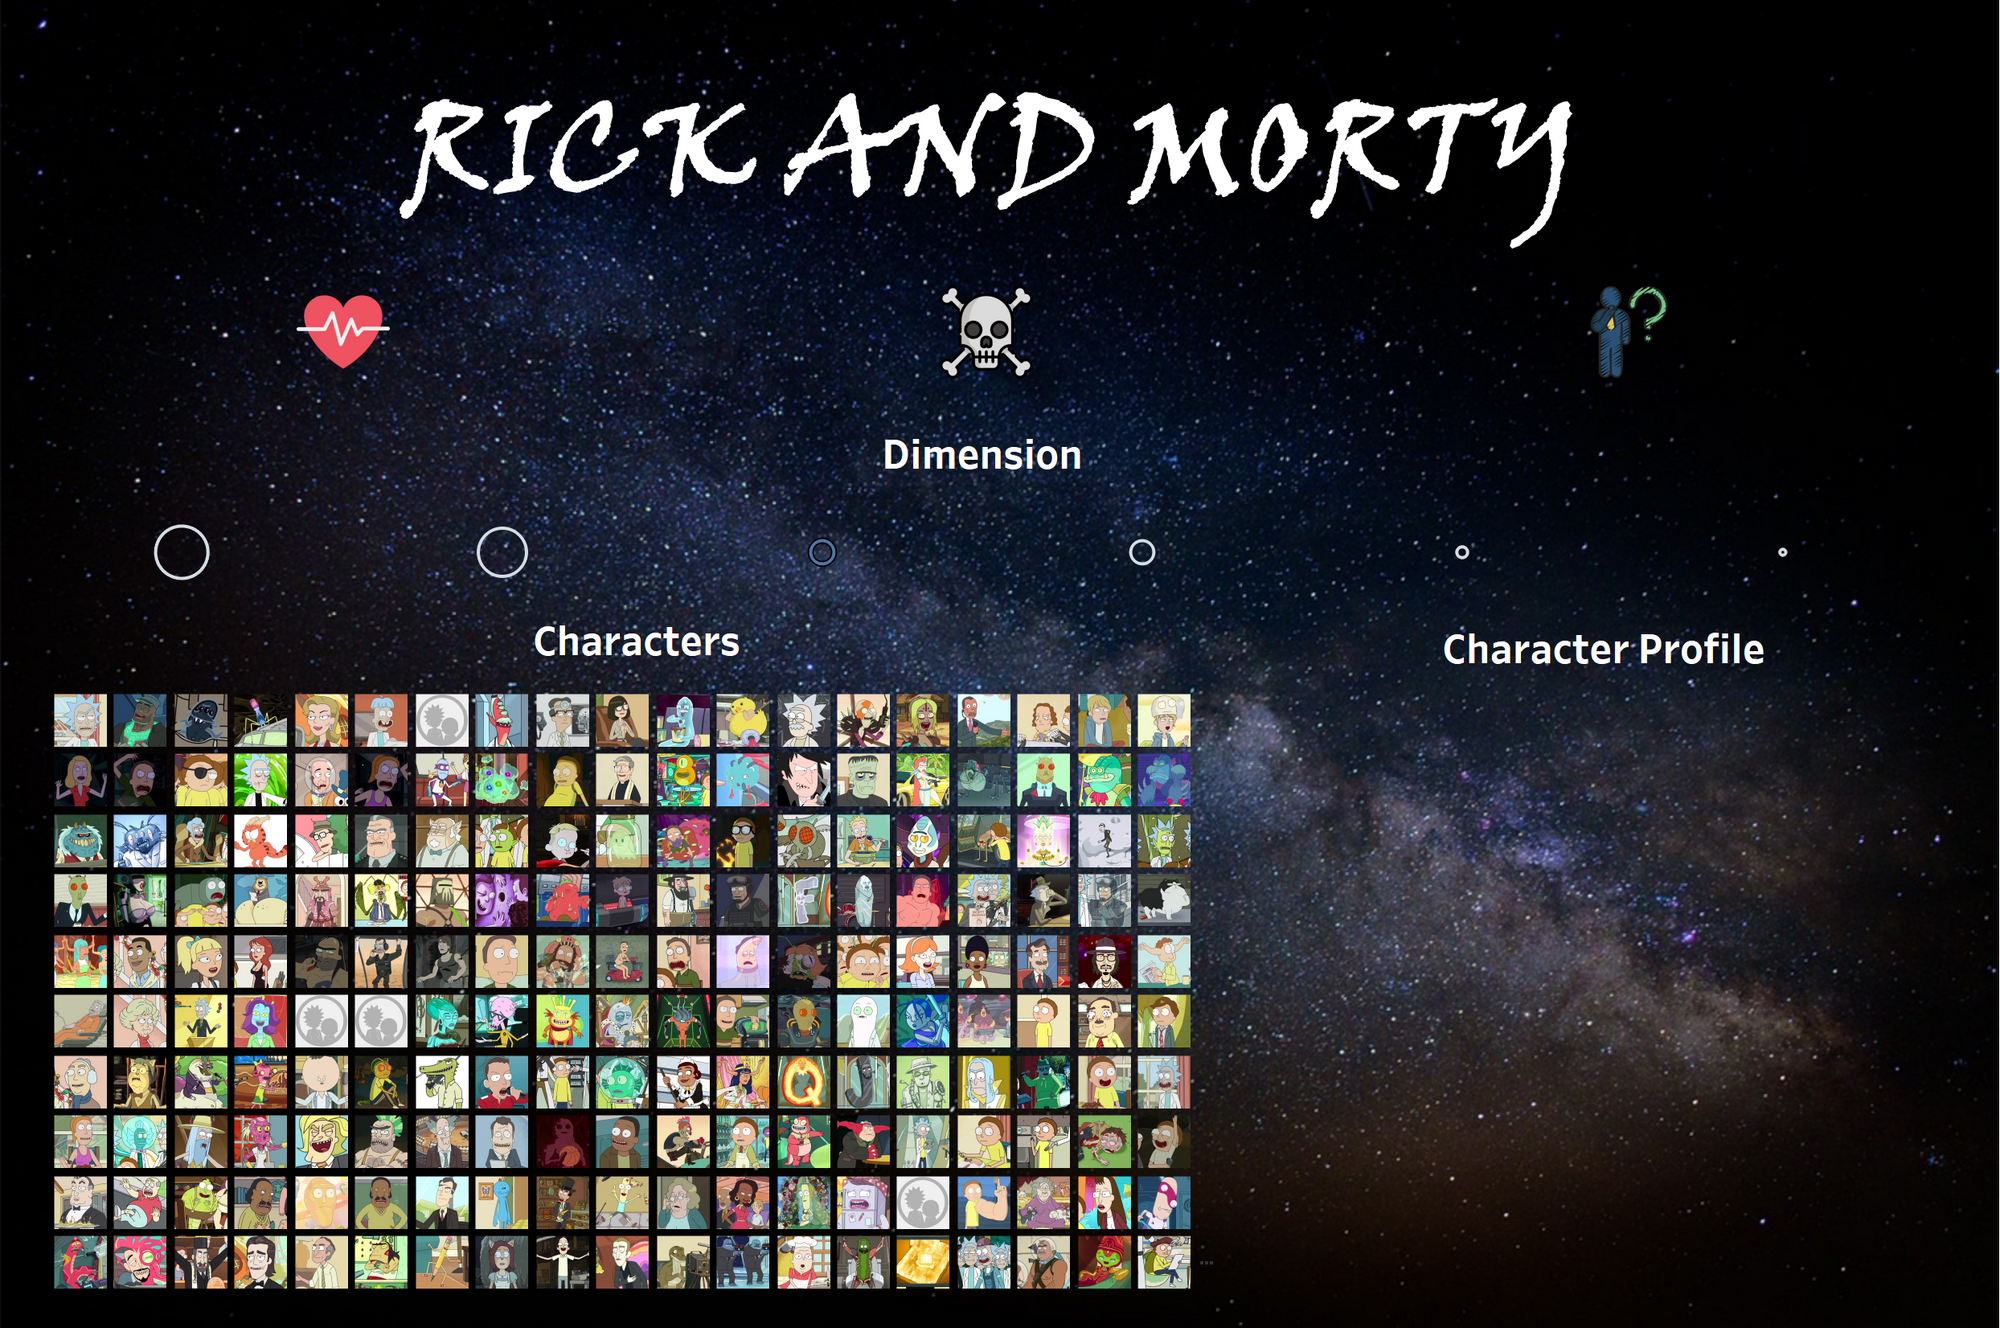
The dashboard below was completely constructed in 40mins, so bare that in mind.