


Today is the first day of dashboard week and we covered accessibility. In the morning we covered what is accessibility, the different types of impairments and how we can create visualisations for specific need.
I was tasked with recreating a dashboard that is suitable for someone who relies on their hearing. The brief was as follows:
A DS project from a prospective new client has come in, requesting a KPI dashboard about their operations. The analysts and BI chief explain during the kickoff meeting that the Chief Operating Officer uses a screen reader, and whatever is built needs to be accessible for her too.
Things I had to consider:
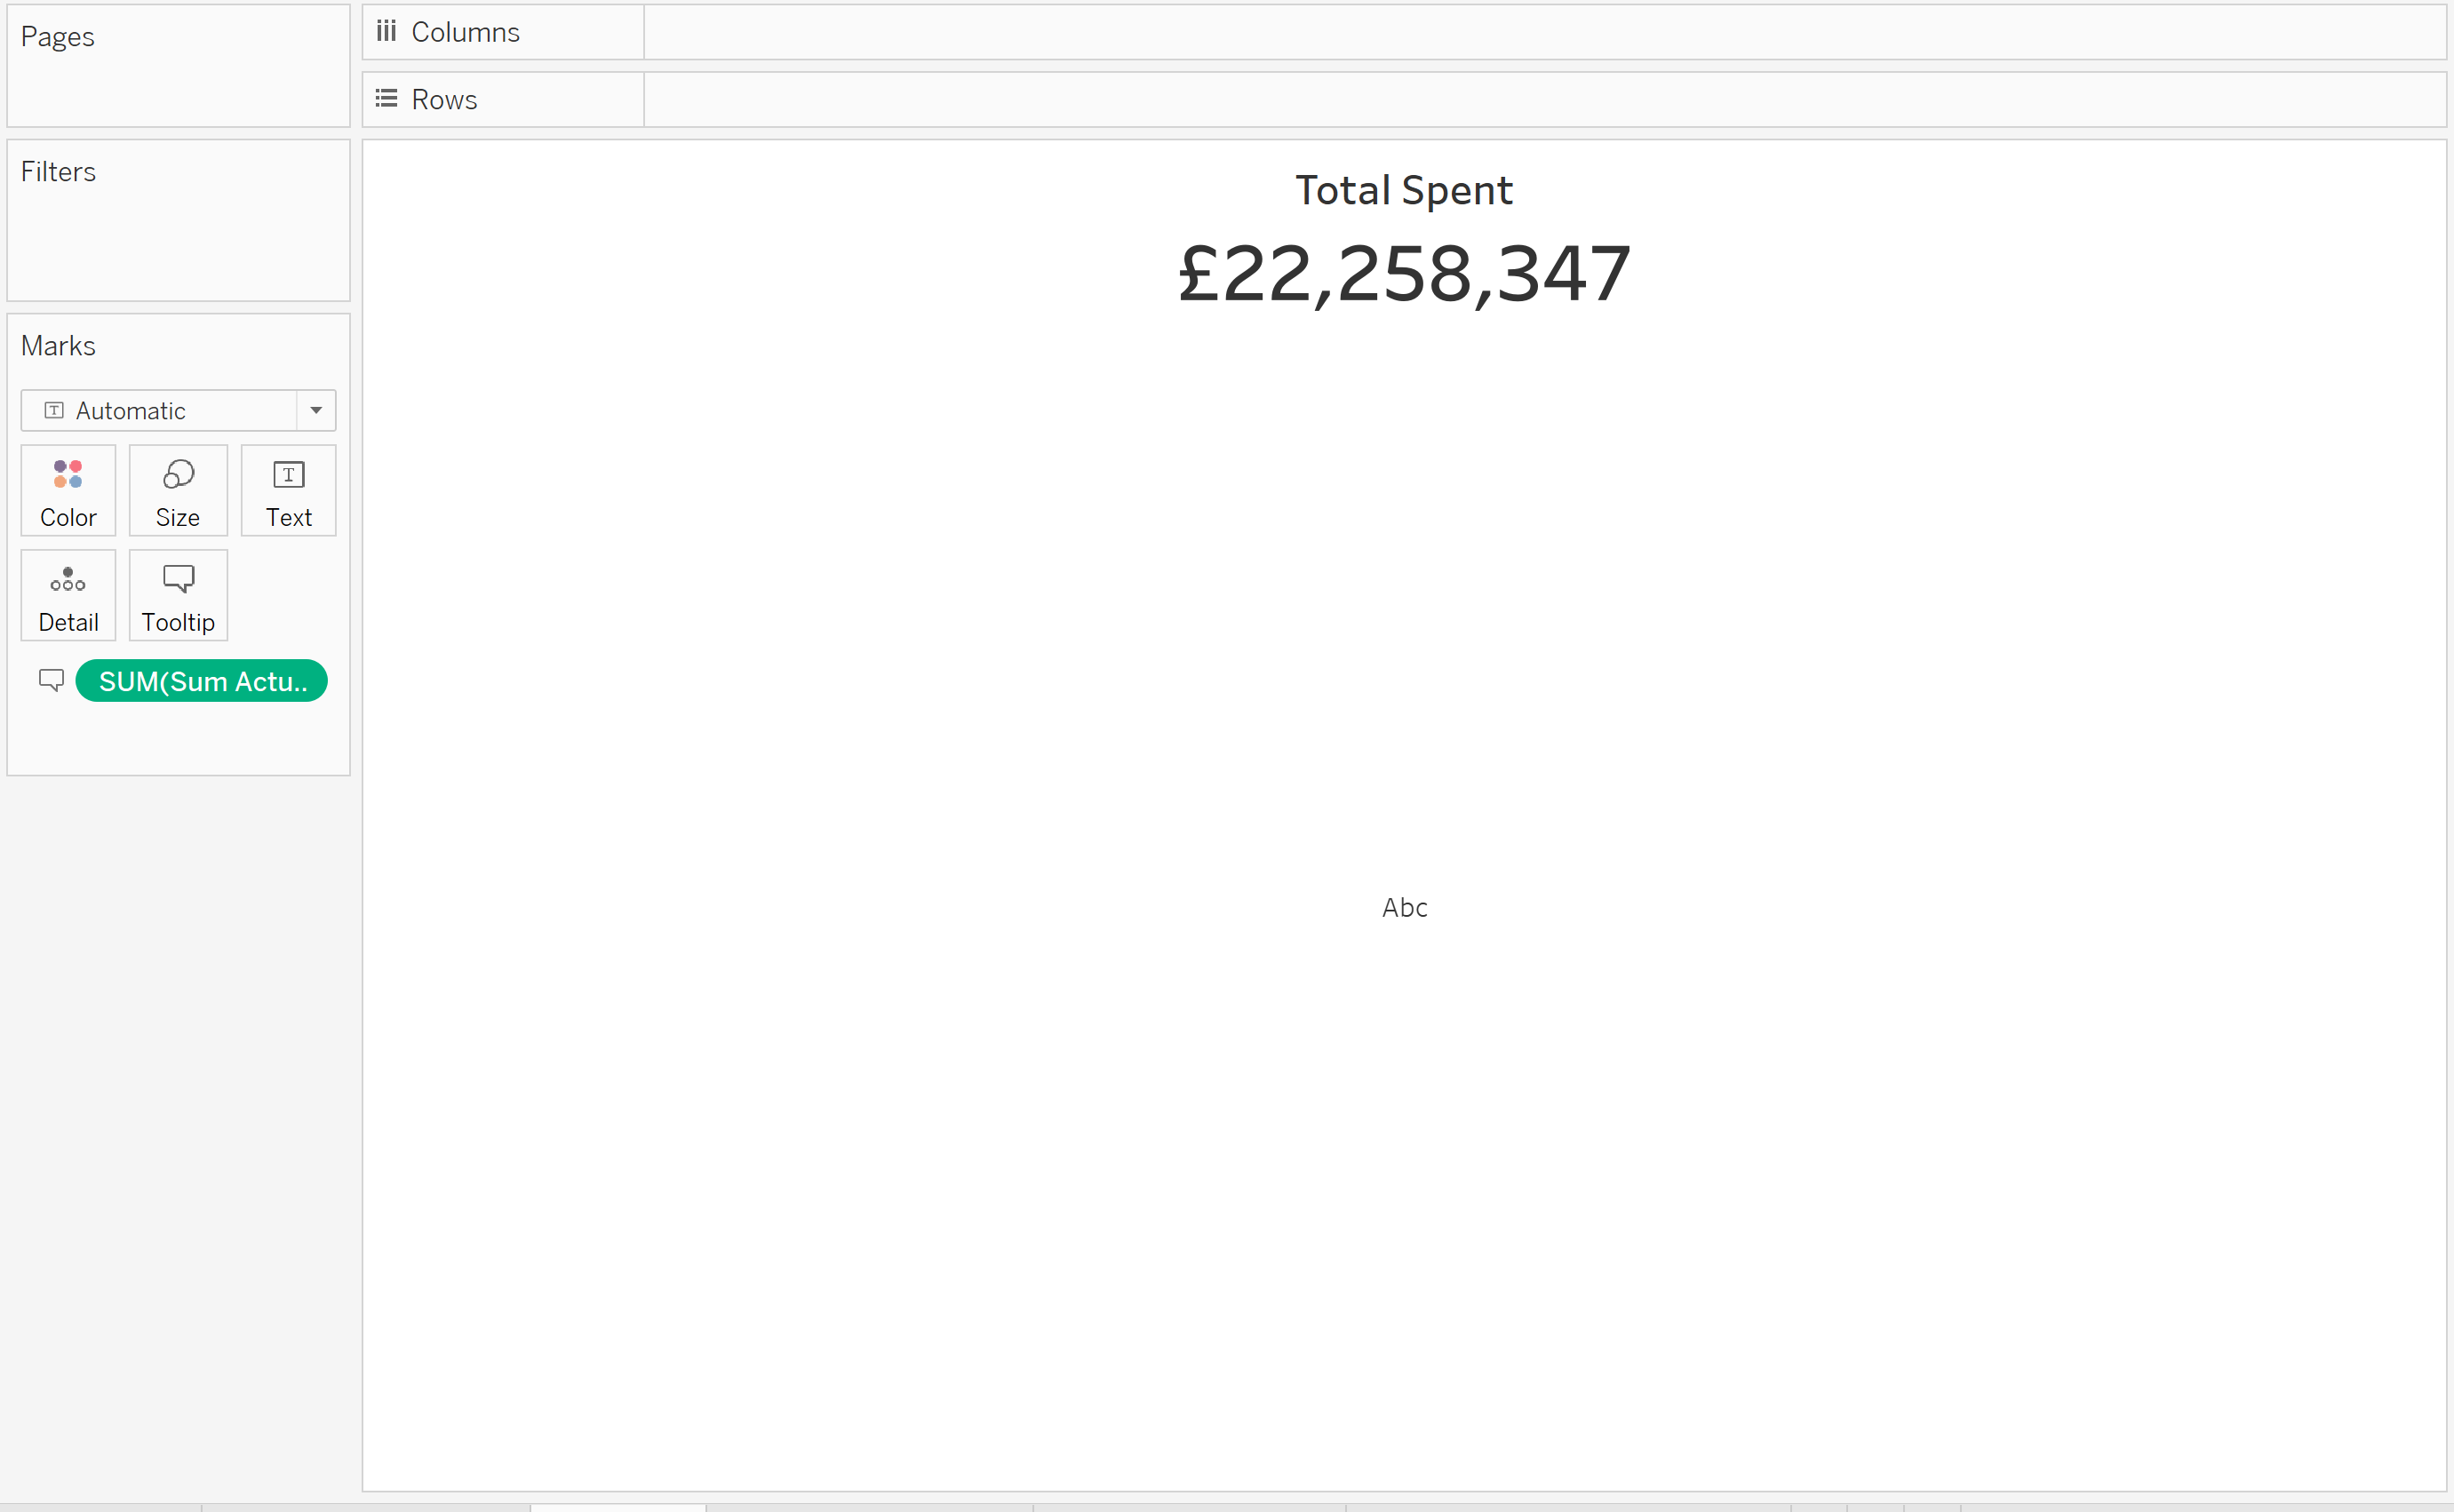
This means that I had to find a different way to create my contextual numbers. Instead of creating a sheet with the KPI, I put the KPI in the title. Like shown bellow.
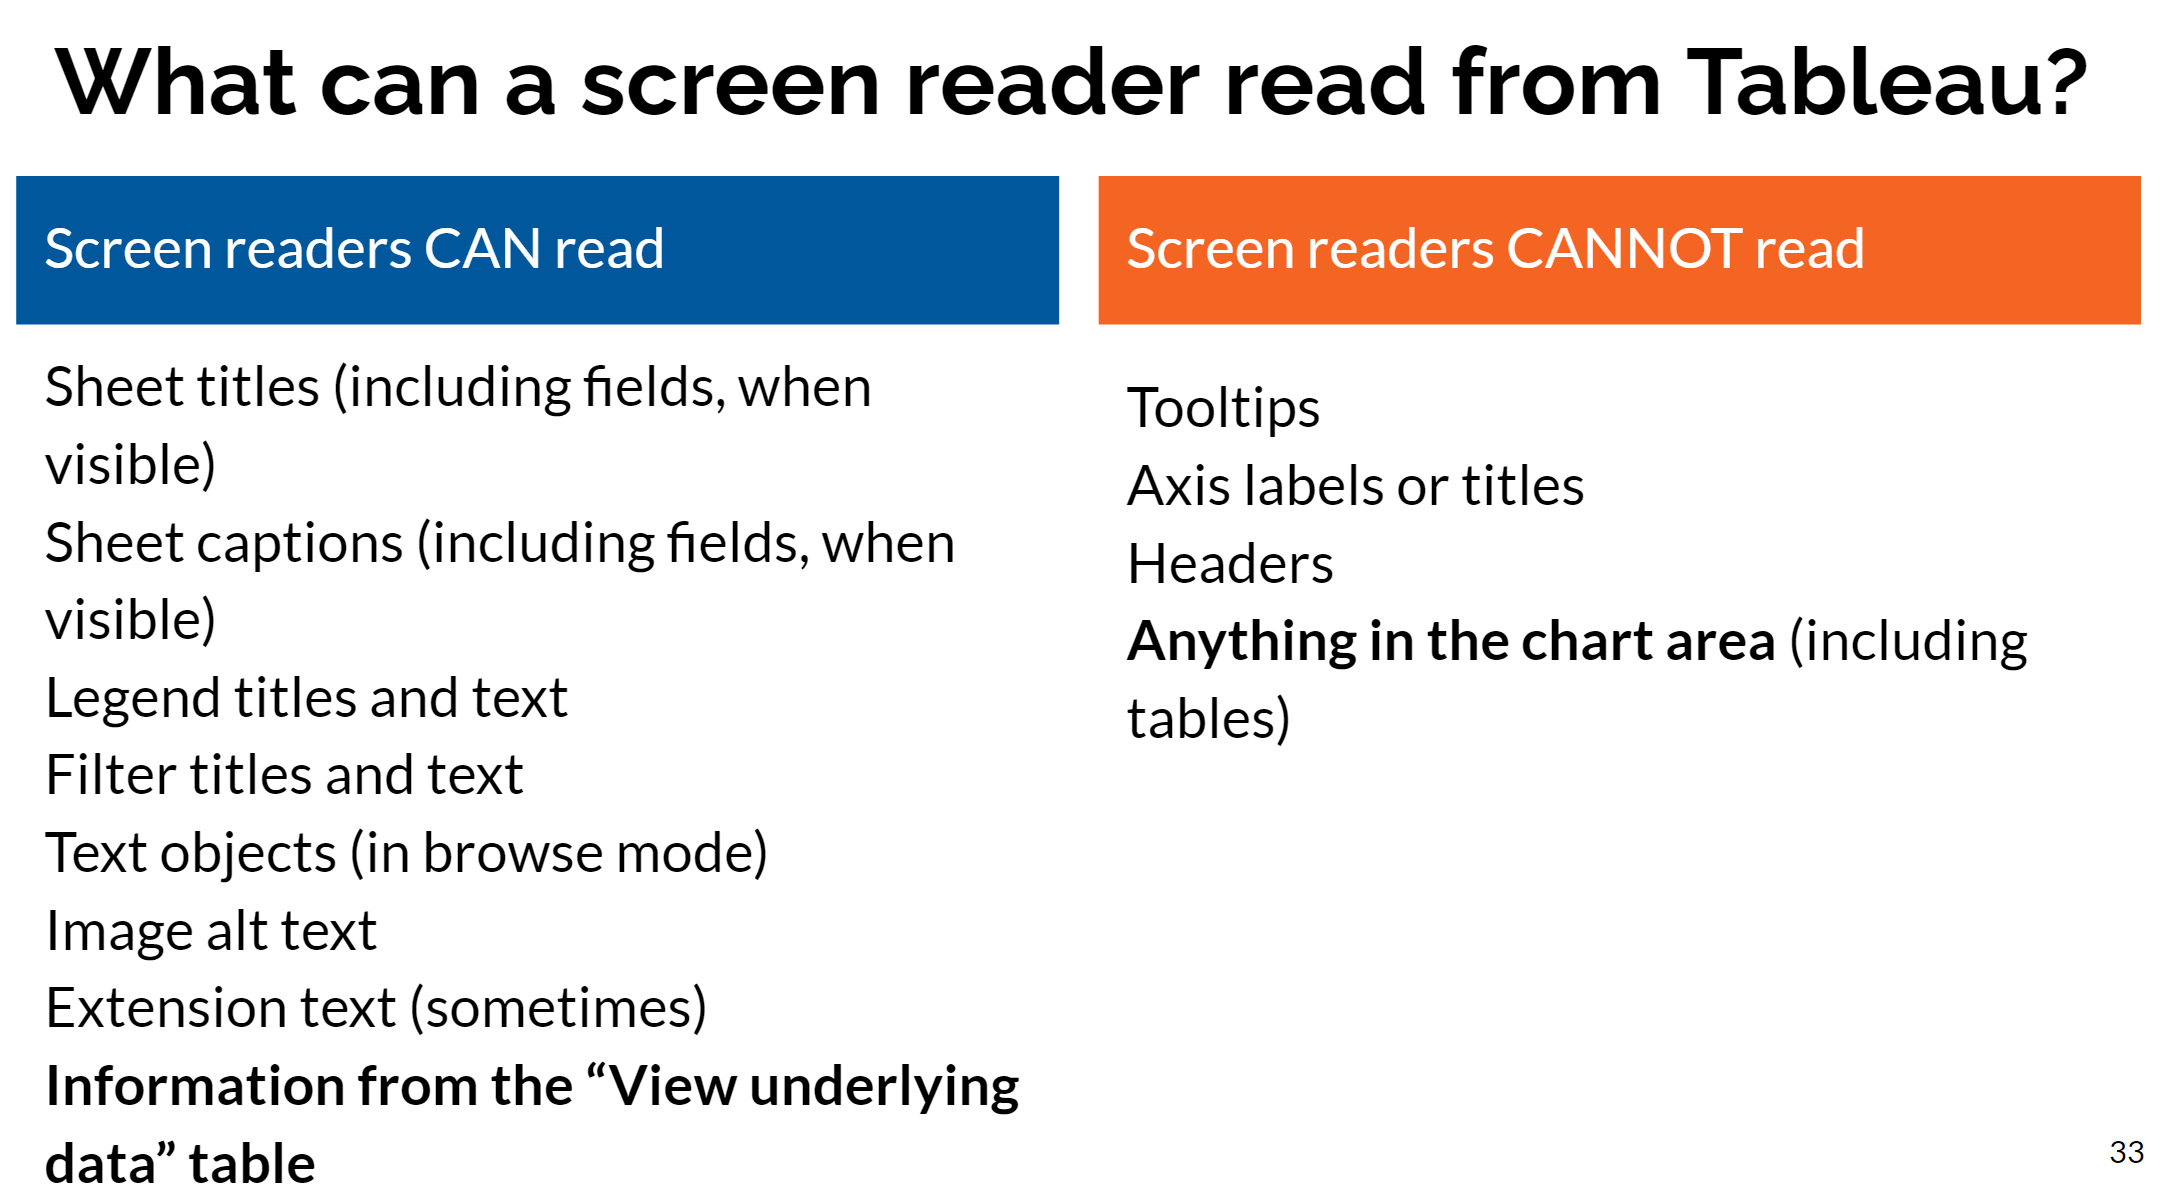
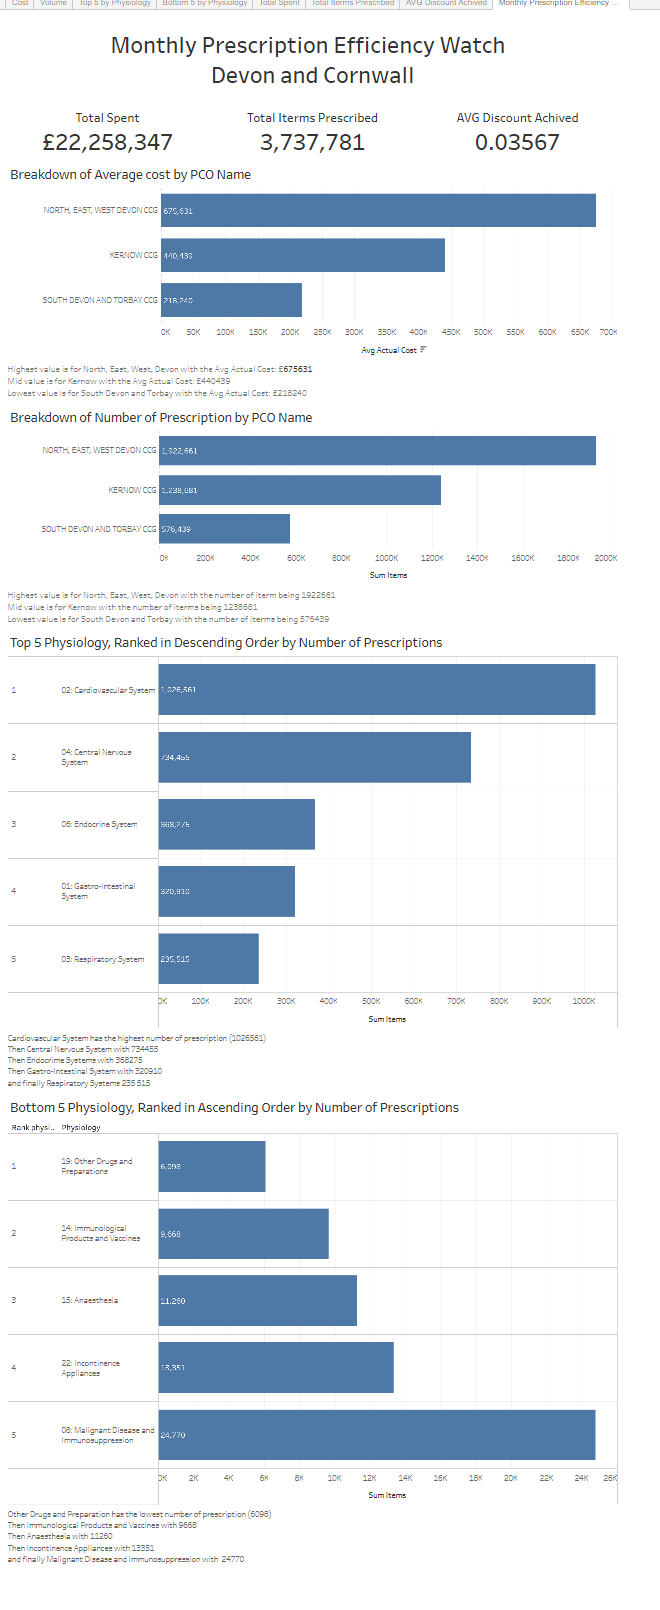
Another thing I had to consider, the screen reader can't read charts so I to create captions explaining what is going on in the chart.
Screen reader is activated by pressing windows + ctrl + enter.
One thing I didn't think about is adding a icon to explain how the viz can be downloaded. That is something I would do next time.