I already knew that day 2 of Dashboard Week would be a stressful one because Power BI is not my favorite tool and I haven’t spent as much time with it compared to Tableau. One of my goals after completing the Data School training is to achieve certification in Power BI and today's task is a great opportunity to get back into using the tool.
The task was to build a report using the familiar Superstore dataset that we all know and love. I decided to create a report for a product manager to help identify top-performing and underperforming products by location, helping them to take appropriate actions, such as promoting or discontinuing products. I'm a big fan of interactivity and drill-downs, so I structured my analysis into three pages, presenting it like a story.
The report answers questions like, "Which products need further development or should be discontinued in specific states?"
Here’s the flow of the analysis:
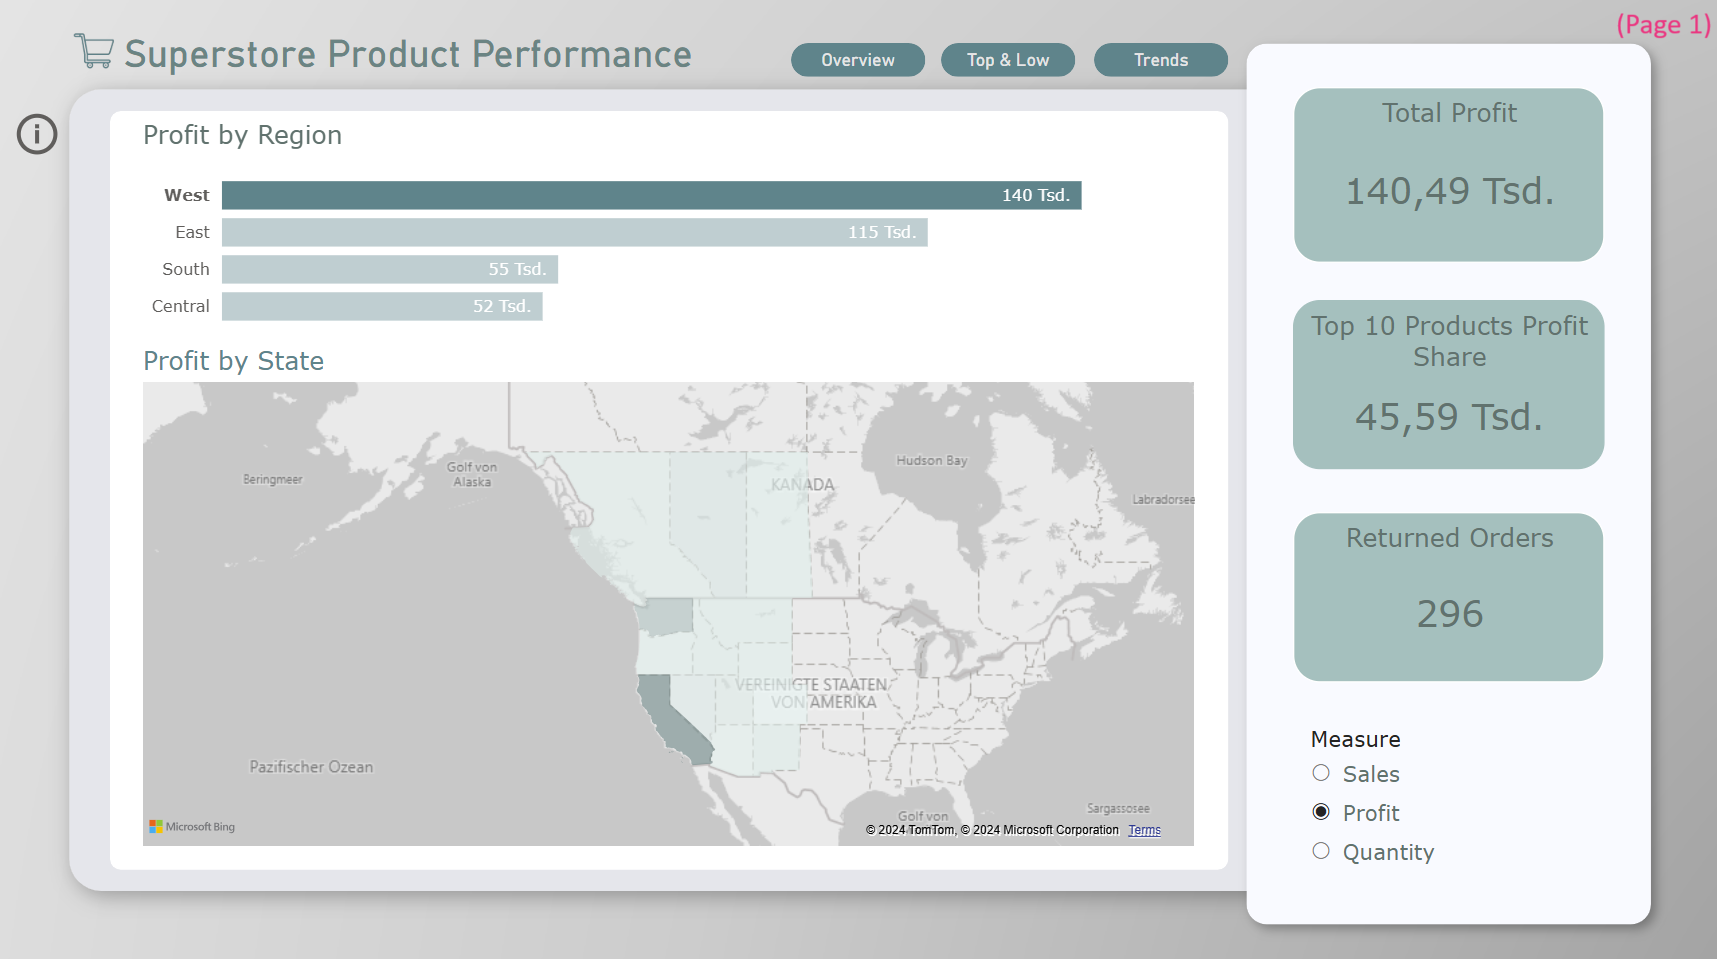
- First, you can see the changes in profit and identify which regions and states are underperforming.
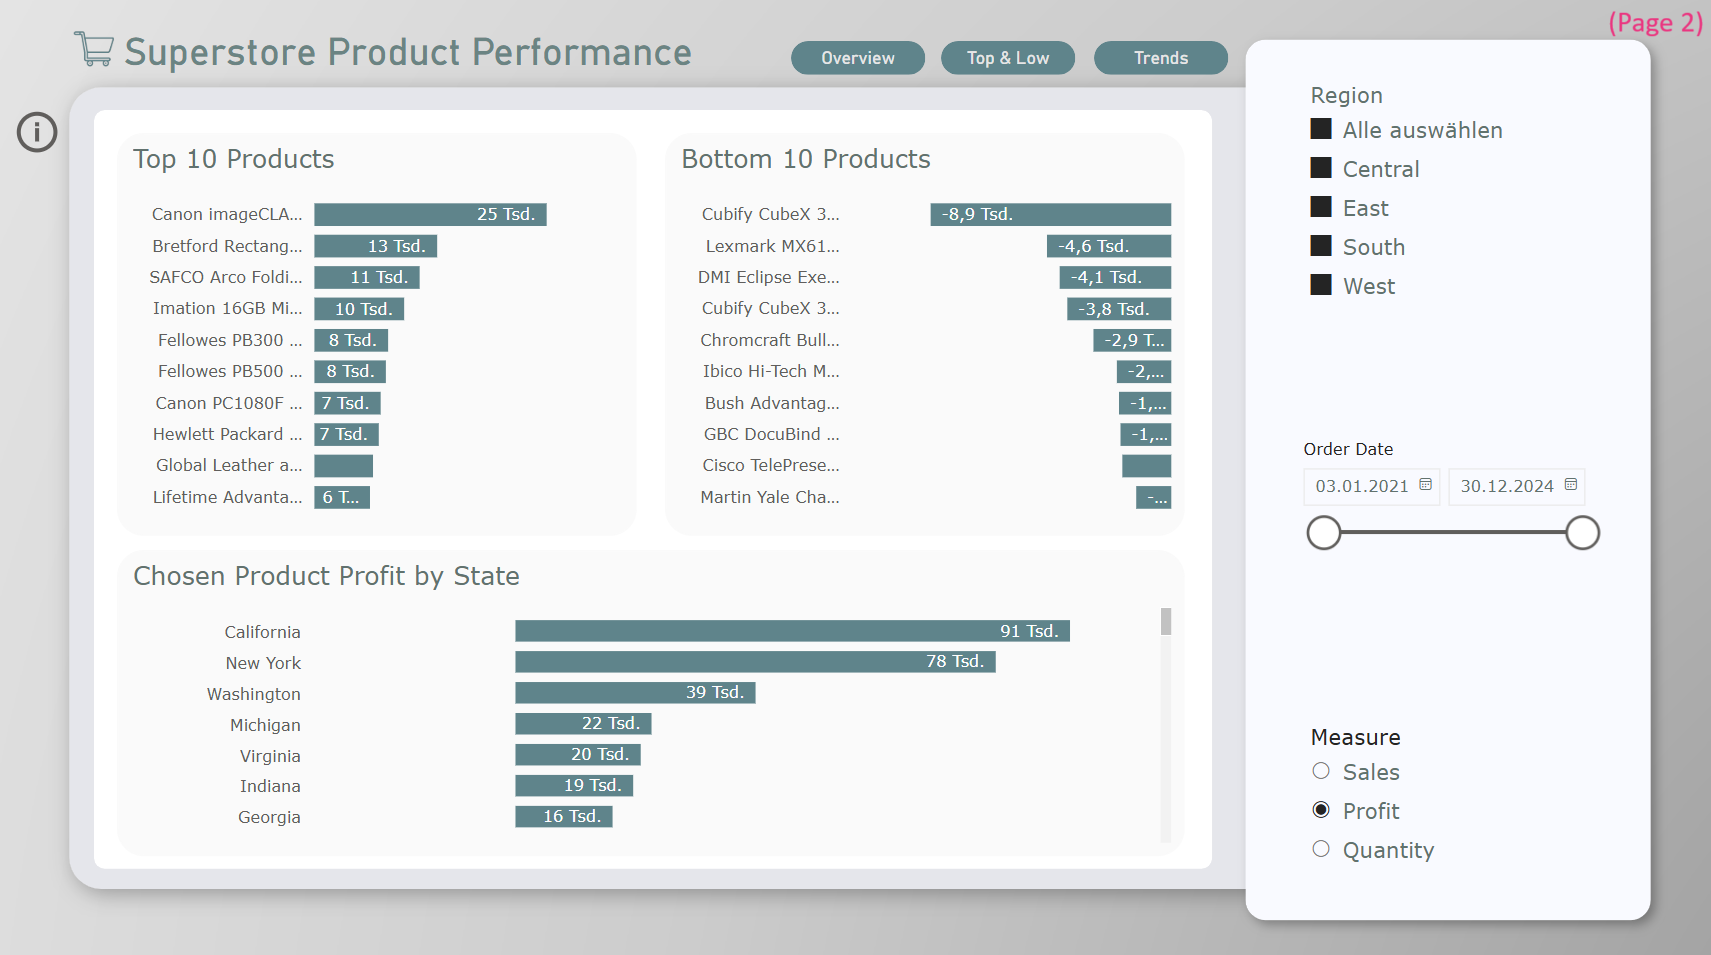
- On the next page, you can filter these underperforming areas and drill deeper into the data for each product’s profit, further broken down by state. At this point, you can already identify products that might need to be discontinued in certain states.
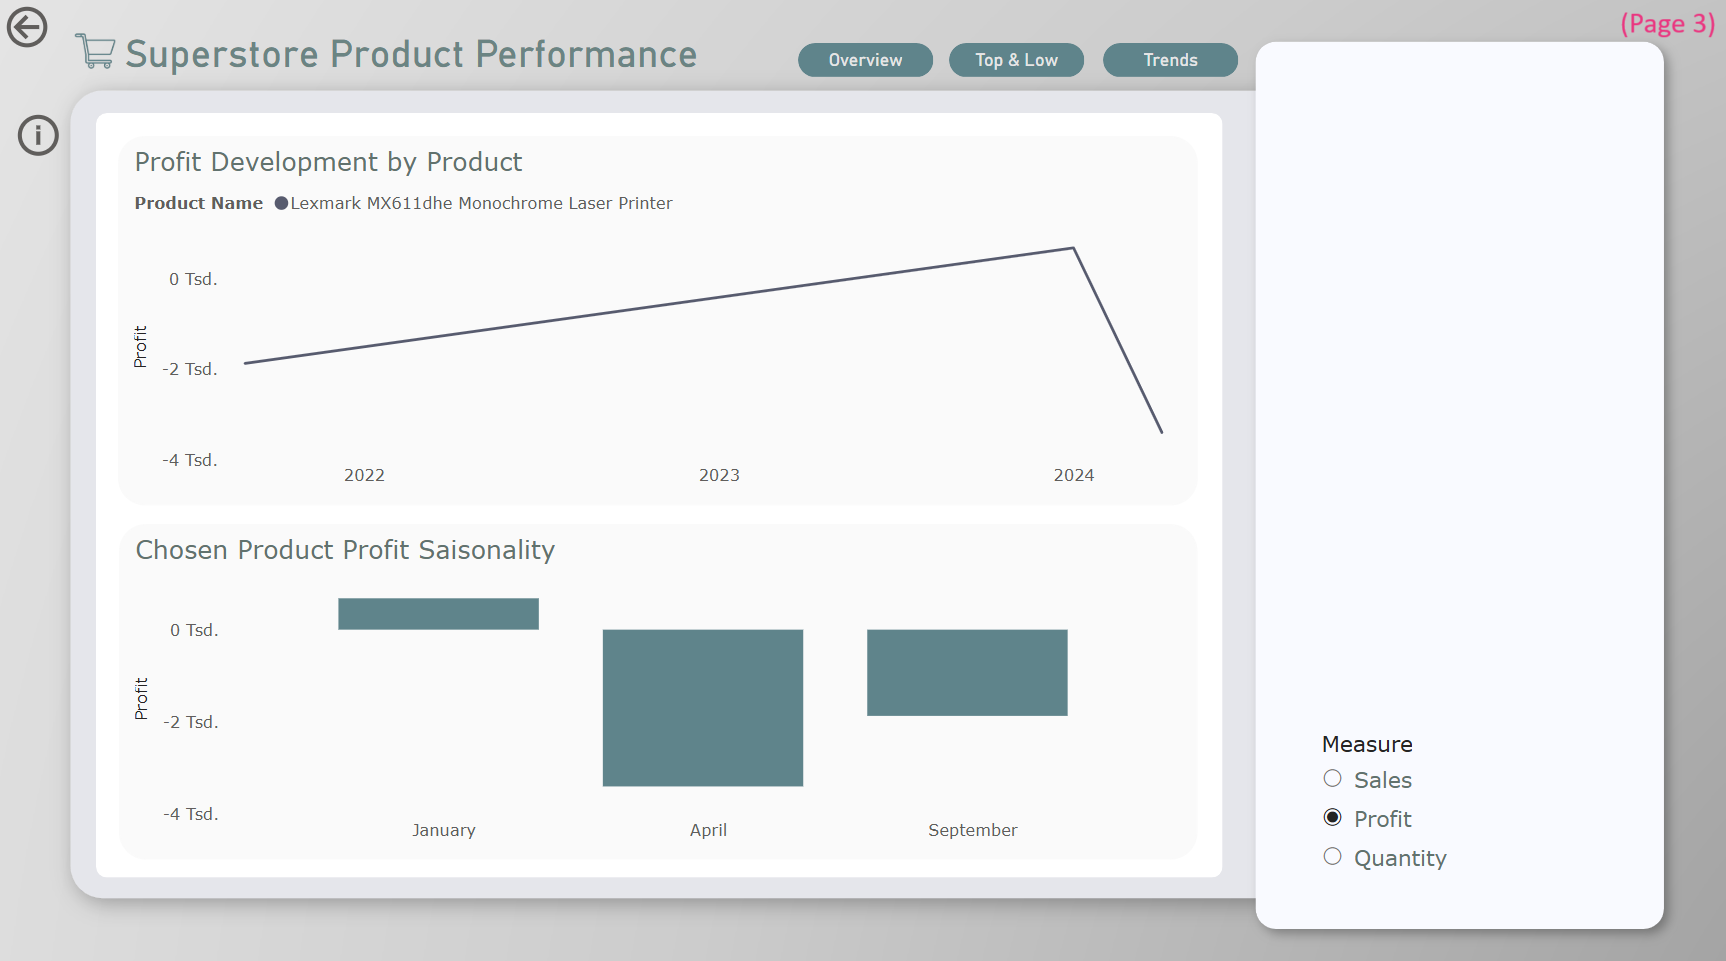
- Finally, to confirm your findings on the last page, you can analyze the profit trend of the previously selected product over time. This helps you determine if the profit decline is due to factors like seasonality or other external influences.
I’m very happy with report version 1 and I’m also excited to incorporate feedback and continue working on it in Power BI. Since I can’t share the link to my report for you to explore its extensive interactivity, I’ve included screenshots below.


