


When you build dashboards, stakeholders often ask questions like “How are we doing this year compared to last year?”
The calculation is important, but what’s even more valuable is understanding the date functions that make it possible.
In this post, I’ll use a KPI example to break down how date functions work in Tableau:
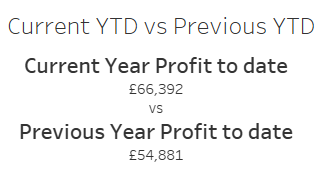
- Current Year-to-Date Profit vs Previous Year-to-Date Profit
Key Date Functions
Before diving into the examples, let’s quickly look at the functions we’ll use:
YEAR→ Returns the year of the given<date>as an integer.DATEADD→ Returns the date resulting from adding an interval to the specified date.DATETRUNC→ Truncates the<date>to the accuracy specified by the<date_part>. This returns a new, anchored date (e.g. the first day of the year, month, week, or day).
Current YTD vs Previous YTD
Step 1: Date Selector Parameter
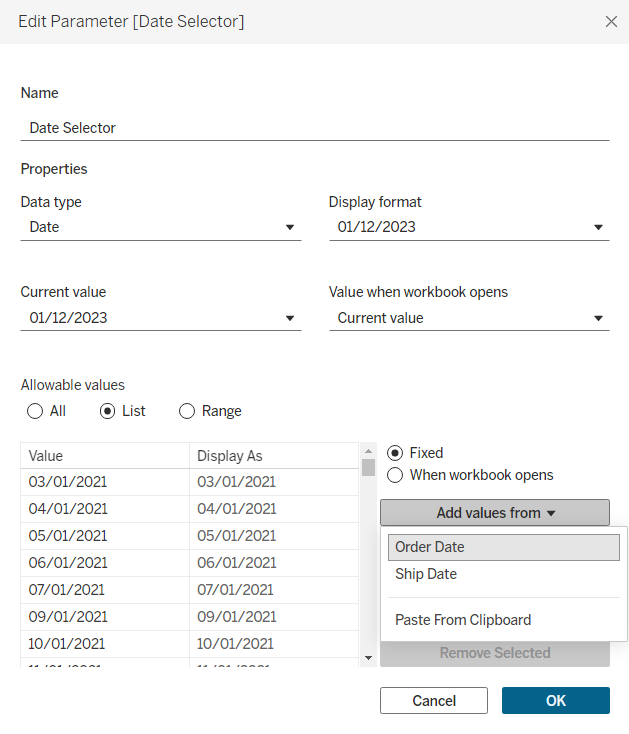
To give the user some interactivity, we first create a Date Selector parameter.
This lets us choose a specific day, which acts as our cutoff point.
We leave the granularity at the day level because YTD is defined as up to a specific day. If we only had year or month granularity, we wouldn’t know where to stop.
Step 2: Current YTD Profit - Calculated Field
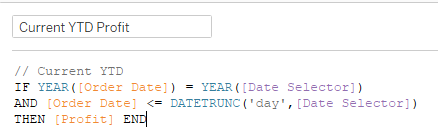
YEAR([Order Date]) = YEAR([Date Selector])→ keeps only rows from the same year as our cutoff.[Order Date] <= DATETRUNC('day', [Date Selector])→ includes only orders up to the chosen date.Here,DATETRUNC('day', …)“rounds” the date down to the start of the day (removes time).
Step 3: Previous YTD Profit - Calculated Field
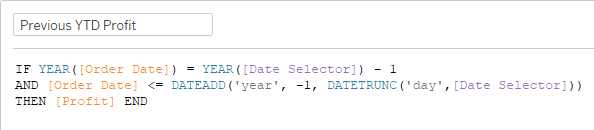
YEAR([Date Selector]) - 1→ moves us to the previous year.[Order Date] <= DATEADD('year', -1, DATETRUNC('day', [Date Selector]))→ includes only orders up to the chosen cutoff date last year.DATETRUNC('day', [Date Selector])→ anchors the cutoff at the start of the day.DATEADD('year', -1, …)→ shifts that exact day back by one year.
This ensures we’re comparing like for like: e.g. 12 March 2024 YTD vs 12 March 2023 YTD.
The KPIs are helpful, but the real takeaway here is learning how Tableau thinks about dates.