What is #IronViz?
The Tableau Iron Viz competition is an annual data visualization challenge that invites participants to showcase their data storytelling skills using Tableau. Contestants create compelling and innovative visualizations on a given theme, competing for recognition and prizes. Contestants’ vizzes are scored based on analysis, storytelling, and design. Three Iron Viz contenders then take center stage (at Tableau Conference) and have 20 minutes to tell the most compelling story using the same data set.
See previous finalists here:
2023: https://www.youtube.com/watch?v=O089fU_lDi8
2022: https://www.youtube.com/watch?v=cIwCJ2V-KX8
How I came to enter
The Iron Viz feeder competition for 2024 ran throughout October 2023. I had every intention of participating and had a few topic ideas related to love (this year's theme), but I struggled to find suitable datasets.
I wanted to delve into the world of modern dating, specifically online dating and the rise of dating apps. After a few rounds of research, I found myself giving in to the idea.
Fast forward to Saturday, October 28th. I was enjoying some downtime from the heavy training schedule of The Data School when I began seeing some submissions trickling through on Twitter. The topics varied, with many focusing on "things you love" rather than love itself.
Ah-ha, I thought.
I had an idea, but I wasn't sure if I had enough time.
Or did I?
My mind wandered back to my university days with those last-minute deadlines.
I sketched out a vague outline of my idea. It seemed realistic and achievable. But did I have enough time?
With the sketch completed and the realization that I would be pushing my limits, I drafted a plan outlining everything I needed to build, data sources to gather, and rough timeframes for each task. Then, I took to Twitter to publicly commit to the plan and hold myself accountable.
The Tableau community responded with plenty of encouraging words.
Great.
Now, I definitely had to do this.
The plan was to get my story straight and gather all my data sources over the weekend. Begin formatting and complete a first draft on Monday. Gather feedback on Tuesday morning, make necessary changes, and submit by Tuesday night.
I faced a slight delay in gathering a data source, which stretched into Monday. Boldly, I aimed to scrape Spotify data using an API in Alteryx, something I hadn't done before. Probably not the best idea with a tight deadline, but as they say, "Win or Learn — You Can't Lose".
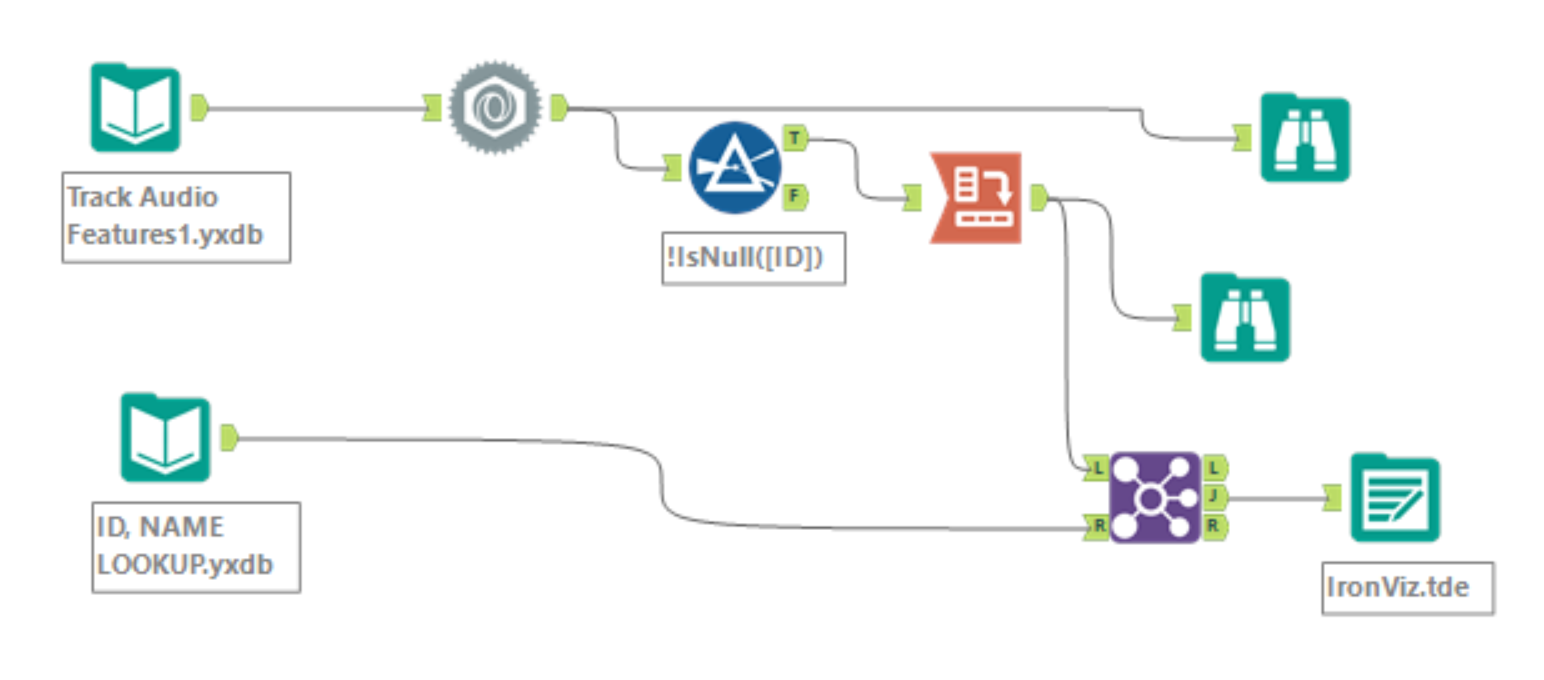
(Stay tuned for an upcoming blog on how I scraped the Spotify data)
The submission deadline was early Wednesday morning (GMT), but I wasn't planning to stay up all night. I had Data School training in the morning so after a mad rush completing some late formatting. I submitted.
I'm really pleased with what I've built in such a short space of time. But I will definitely be starting sooner next year.
You can check out my final design and link to my Tableau Public below.
Title: "For the Love of Music and Fred Again"
Topic: The viz (visualization) shares my love for music and the discovery of my favorite artist, Fred Again, following a viral DJ set shared on YouTube.
Tableau Public:
https://public.tableau.com/views/DraftIronViz2024/Dashboard3?:language=en-US&:display_count=n&:origin=viz_share_link