


"Do I learn Tableau or Power BI?" is a question you often see from aspiring data. After an introductory session this week, I can now say I have used both and they are very, very different.
As a Tableau user, moving over to an alternative data visualization tool felt a bit clunky. The interface felt familiar, with similar toolbars and logic to Microsoft Excel, PowerPoint, etc. However, the many customizable options with dofferent naming structures left me feeling a bit lost.
After just a few hours of teaching and playing with the tool, it's expected to feel frustrated, especially when Tableau now feels so native and intuitive.
However, in just a few hours, we completed a web scraping exercise, performed data cleaning in Power Query, and put together a few dashboards to get familiar with the tool.
After just a few hours, here are my five favorite Power BI and Power Query features so far:
- Web Scraping: Web scraping is made easy with Power Query, allowing you to identify tables from web pages to include in your analysis. We scraped data from rottentomatos.com and quickly put together a dashboard with some interesting colour formatting.
- Data Cleaning (Field Splitting): "Add Column from Example" in Power Query is a great function for splitting columns. Simply type in your desired field value, and Power Query will attempt to replicate this with your remaining columns using built-in logic. This makes cleaning data fast and efficient.
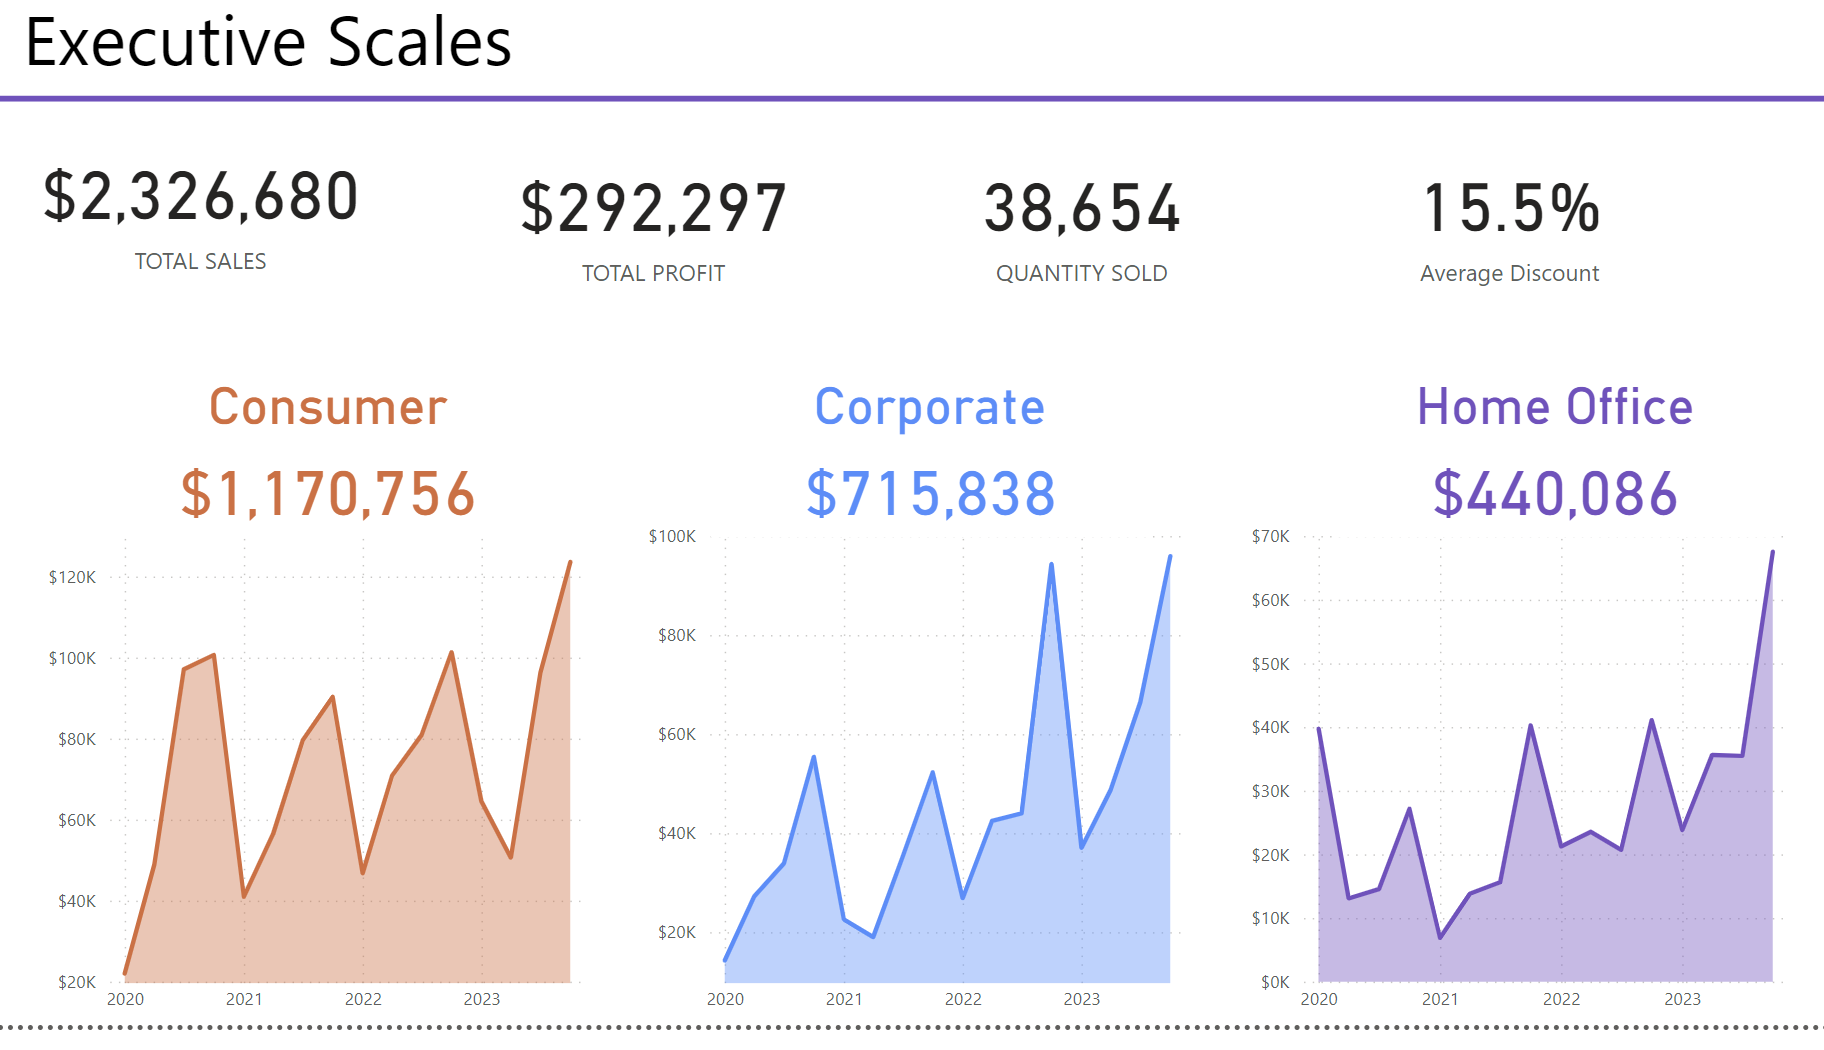
- Custom Format Templates: Power BI allows you to customize your own templates, including fonts, font colors, and color palettes. This is really handy for reproducing dashboards quickly under company branding. This feature can also be used to quickly apply formatting changes to an entire dashboard in just a few clicks.
- Mobile Dashboards: A great feature that is intuitive to build is the mobile dashboard feature. Quickly build reports for mobile dimensions, allowing end users to get the insights they need quickly from their phone.
- Dashboard Layout: Similar to the grouping option in other Microsoft tools, in Power BI, it's easy to group dashboard elements and move them around the dashboard. Certainly a welcome feature when playing around with dashboard layouts.
I'm sure this list will grow the more I use Power BI, but my first impressions suggest it will take some time to get used to navigating around.
Either way, it's good to have both tools in the toolbox in order to be a versatile data analyst.