5 topics, 5 dashboards, 5 days.
Day 4 and Day 5 was all about movies. Our task was to submit a viz for the Data + Movies challenge by Tableau.
The challenge is partnership between Tableau and IMDb — the world’s most popular and authoritative source for information on movies, TV shows, and celebrities. The aim of the challenge is to explore data stories in the movies you love.
Robbin gave a few hints at the beginning of the week, as to what the challenge may be about. I had some time to prepare and come up with some ideas. The idea I landed on was Disney: Comparing Original movies to remakes.
The plan:
- Identify a scope/story
- Interrogate the dataset
- Sketch the dashboard and sheets
- Build the charts
- Design a dashboard/infographic
- Reflection / notes
Planning and Sketches
With the extra time provided to work on this project, I spent a little more time than normal on planning and getting inspiration. I jumped across to Tableau Public for ideas and designs to see what stories I could tell and how to present my insights.
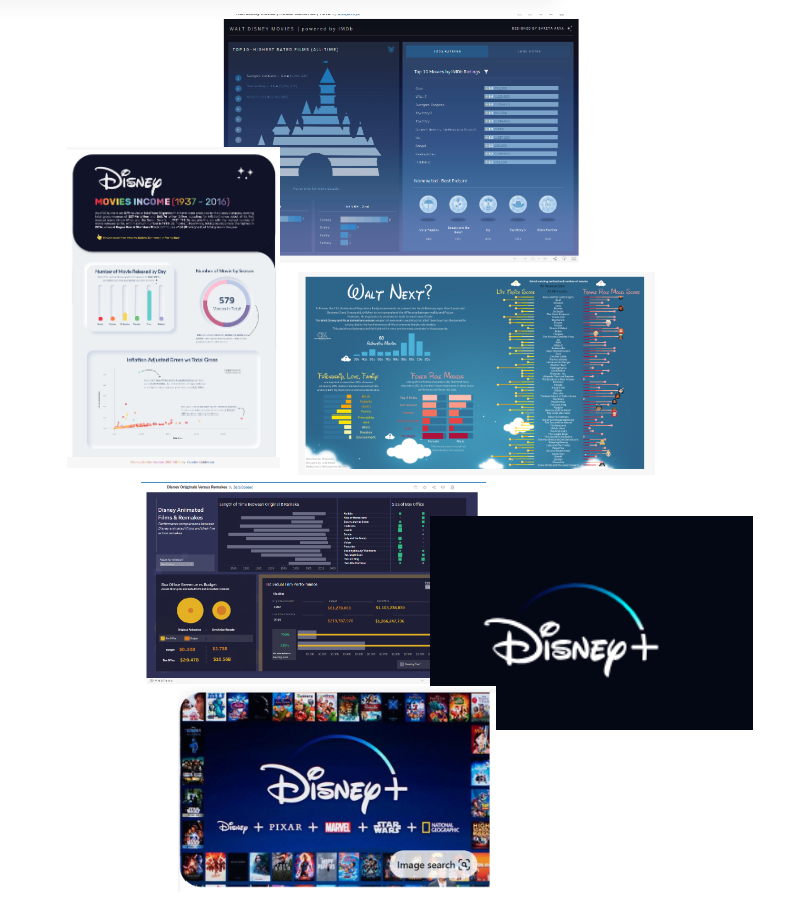
With inspiration gathered, began to write out a plan for Day 1.
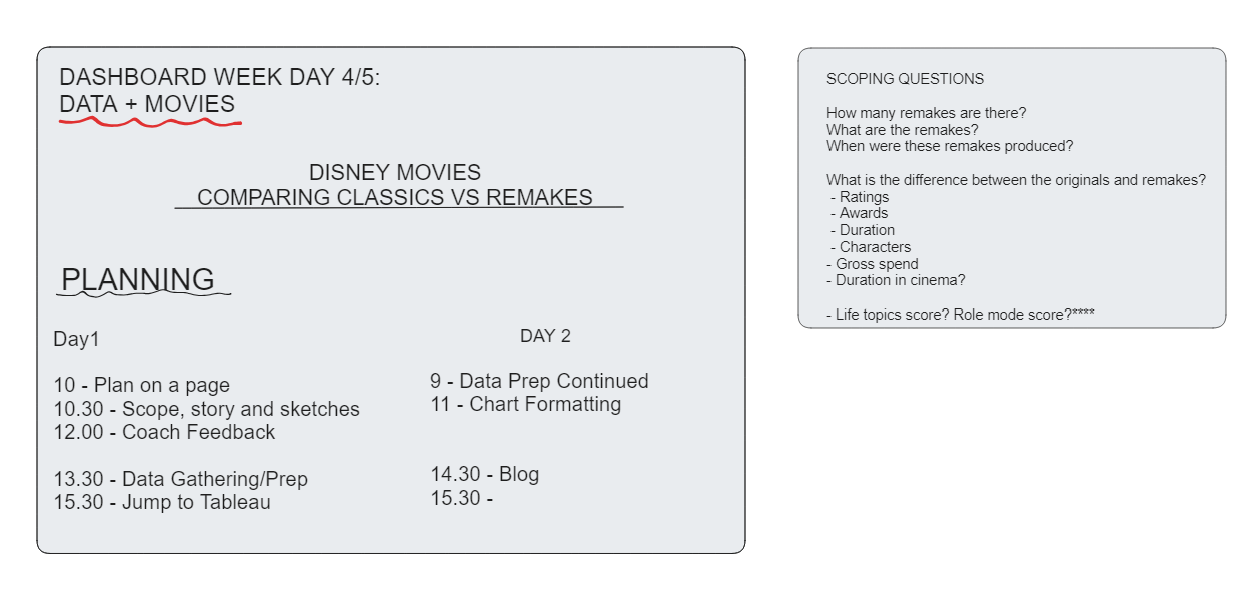
I started to sketch out my ideas and checked-in with the coaches for feedback.
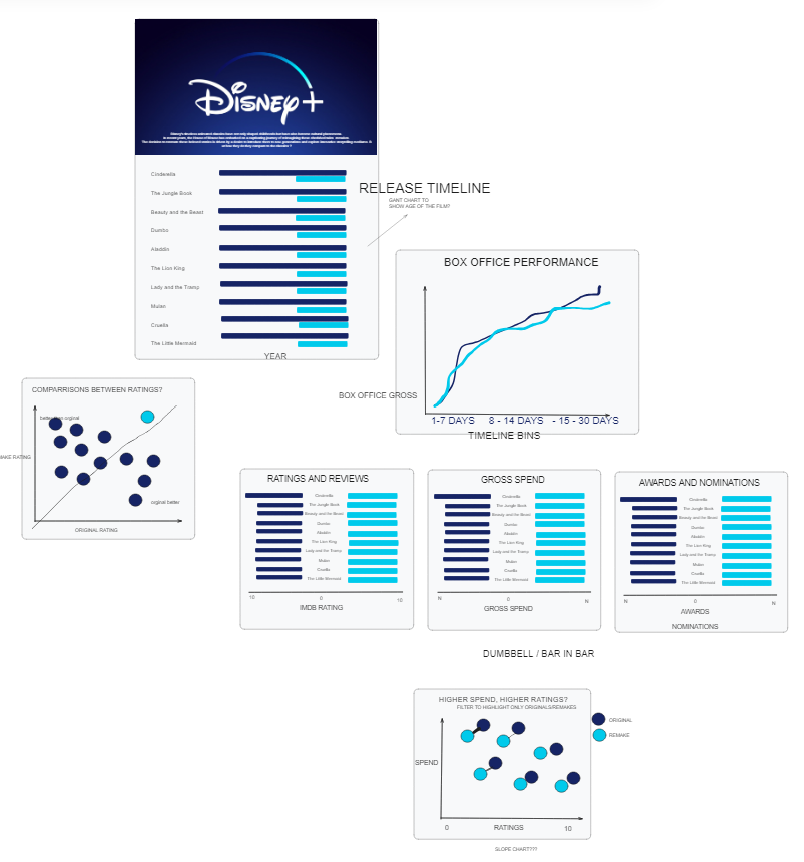
Data Prep
With the sketches sorted. I got work with planning and preparing the data. When interrogating the data early on I knew I would need to source more data relating to the financial elements. I went on the look out for these and found a few sources that required some reshaping of the data.
Before jumping straight into data prep, I put together a mock dataset to test how I would build out my charts and visualizing in the most effective way. I found value in building the template charts which enabled me to build quicker later on.
Once I had an idea of the charts, I then went on to filter the dataset to retrieve just the movies I needed. I also had to navigate the different spelling of names and deciding on a list of movies to work with (some movies are described as prequels/sequels instead of remakes). I came into an issue where the data had multiple records depending on the language the movie was released in, for example some movies had different release years so I needed to filter these out by aggregating on the movie name. My Prep work flow looked like this:

Design
Like most Tableau Public content, to make that this piece of work stand out, I knew there would be a big design element involved to make my work visually appealing. I've had a play around with Figma previously, so thought I could use the extra challenge day to work on some Figma design skills. Here's the design I landed on for my header.
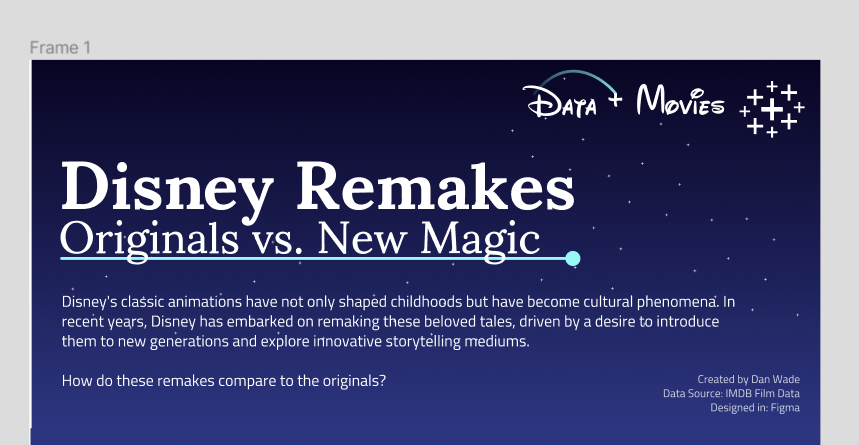
Dashboard and charts
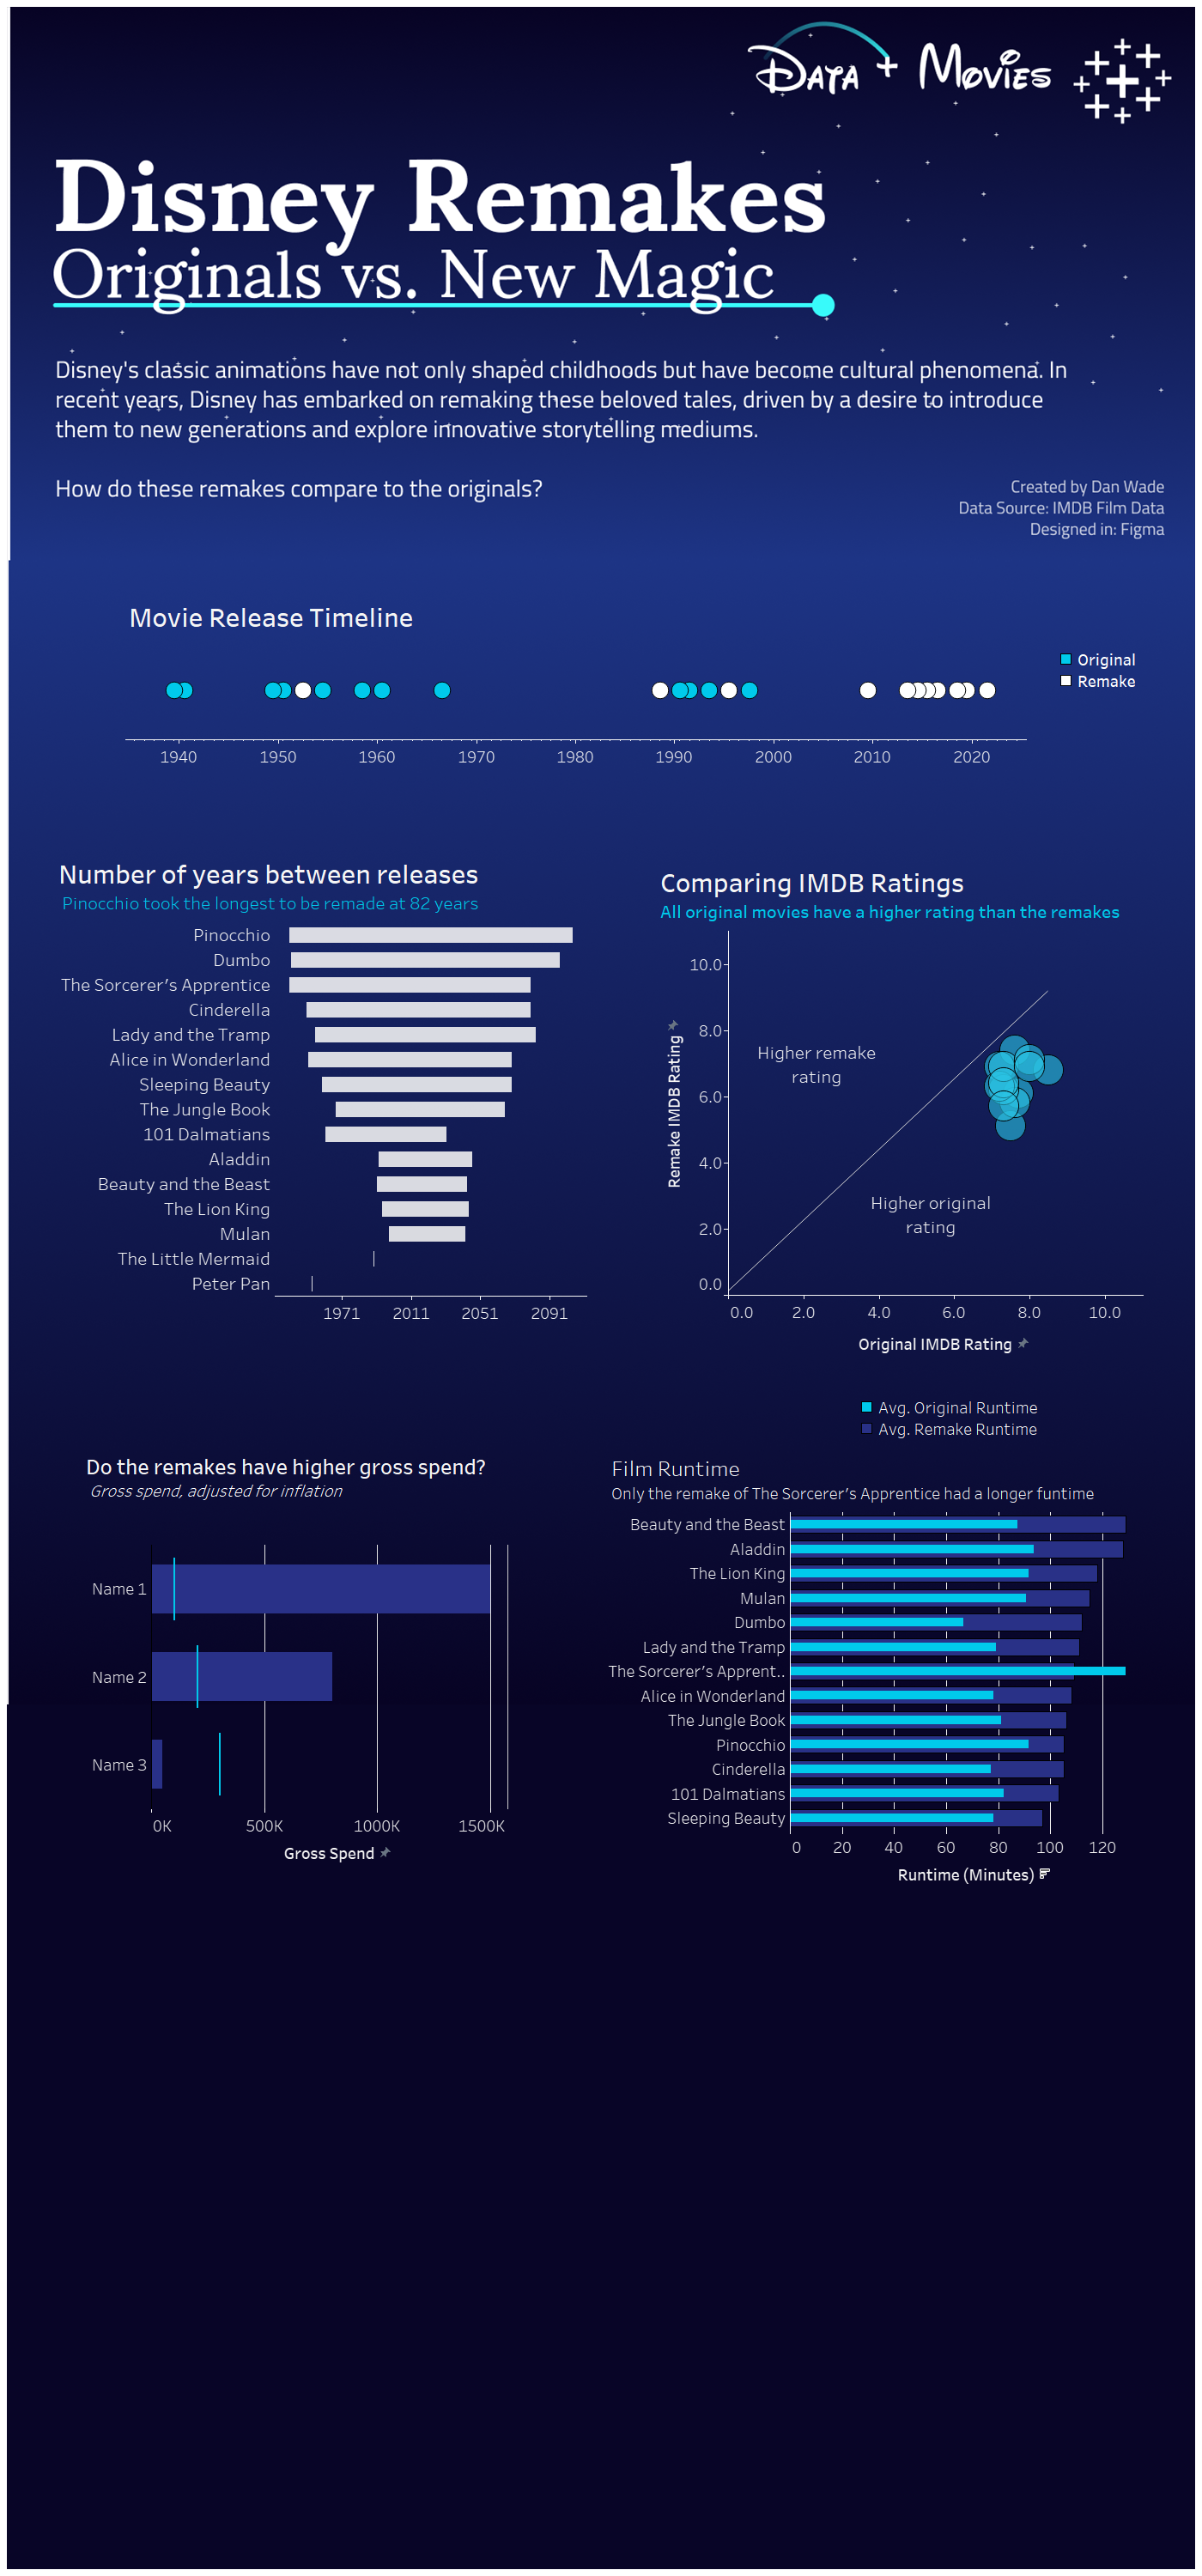
Here is how far I got with the dashboard. Good progress has been made, but there's still some work to do. I'll add this to the list of personal project to finish.
I've added a placeholder of where the additional data will sit, there's also a couple of charts to add at the bottom of the page relating to the financials of the movies.
Reflections
- TBC
