Day 2 at The Data School marked the official start of our training.
In the morning session, we covered topics such as key terminology, data sources, the flow of data, and data architecture.
During the afternoon session, we shifted our focus to understanding how to address questions using data. This process begins by creating user stories that help us align our objectives.
We were introduced to the XYZ framework, which is used to structure user stories:
"As a X, when I Y, I want to be able to Z."
For instance: "As a sales manager, when I am writing my monthly reports, I want to be able to see who in my team are top performers."
By framing our user stories this way, we can maintain a clear focus on our goals. The objective is to guide our analysis in order to assist a specific person (Person X) in achieving a specific outcome (Outcome Z) when they are performing a specific action (Action Y).
Once you have a well-defined user story, you can continually refer back to it as you refine your design.
To practice this concept, we were provided with a dataset related to rat sightings in New York. We had no specific instructions but were tasked with generating a potential user story before creating a draft.
Here's the user story I came up with:
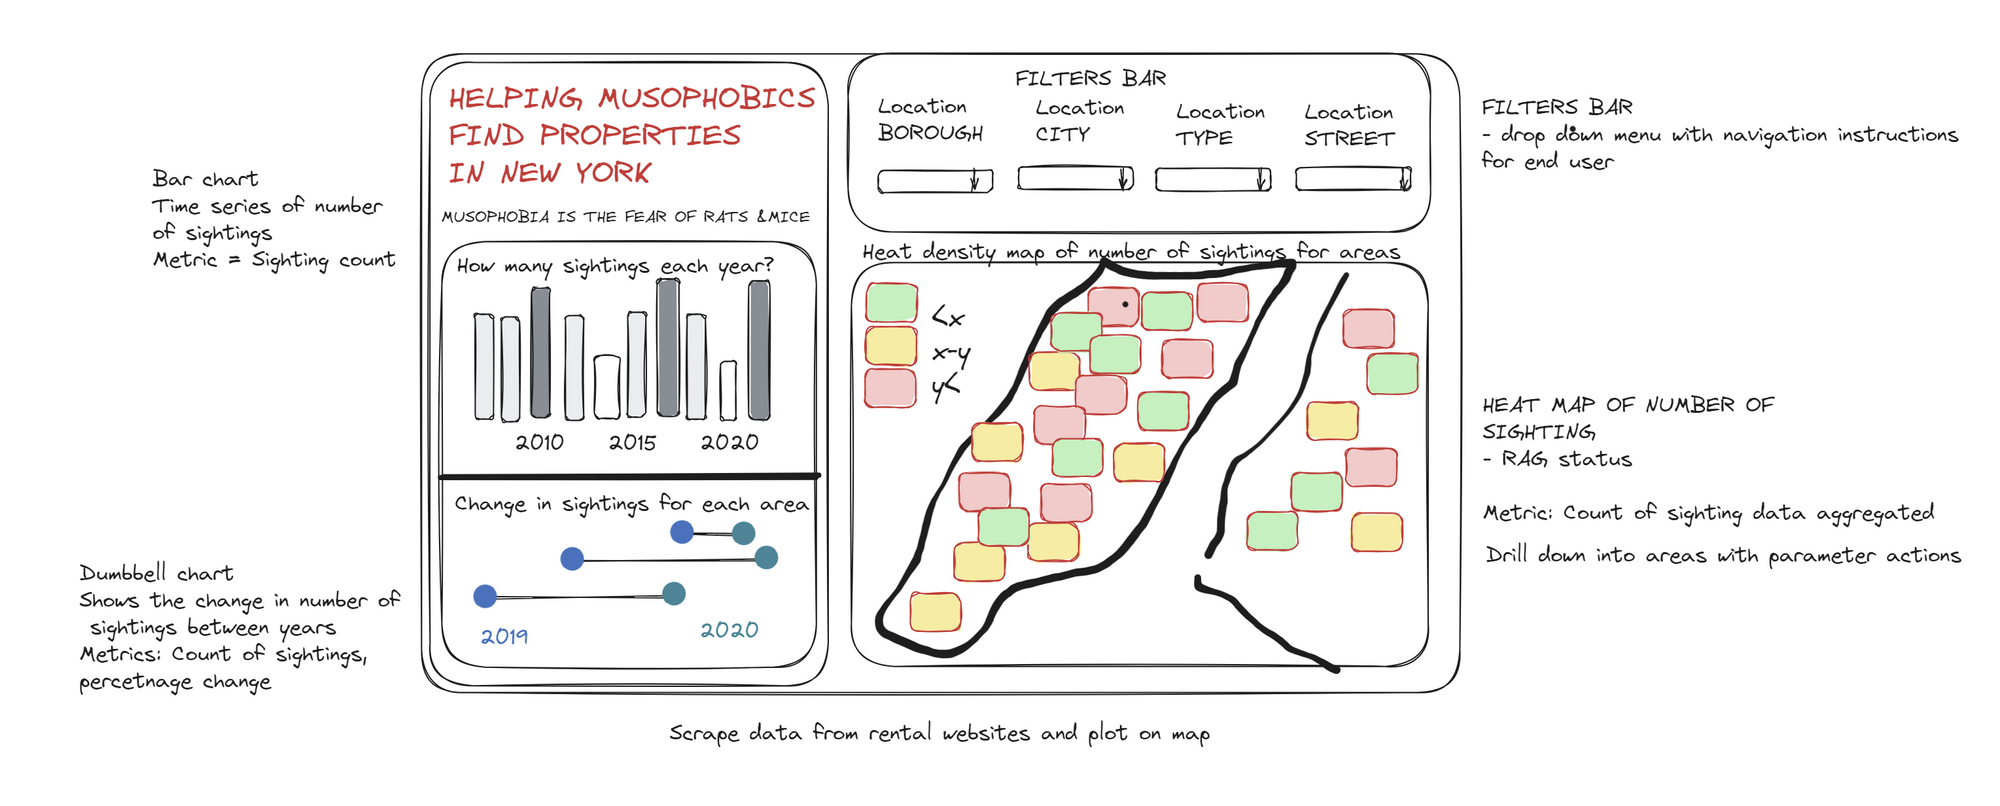
"As someone with a fear of rats (MUSAPHOBIC), when I search for places to live, I want to be able to avoid areas with a high rate of rat sightings."
Once the user story is established, you can start sketching out your design and planning your visualization. It's essential to consistently reference your user story during this process.
Here is the final sketch.