


Today we were tasked with building a dashboard using data we obtained from an API. For this project I focused on improving my dashboard design skills with the use of Figma. Figma is an open source design software, which can be used to build visually striking dashboard backgrounds. The final dashboard I created can be found using the link below and this blog will talk through how you can use Figma in your own work.
https://public.tableau.com/app/profile/dan.booth/viz/PremierLeague2425TeamPeformance/TeamStats
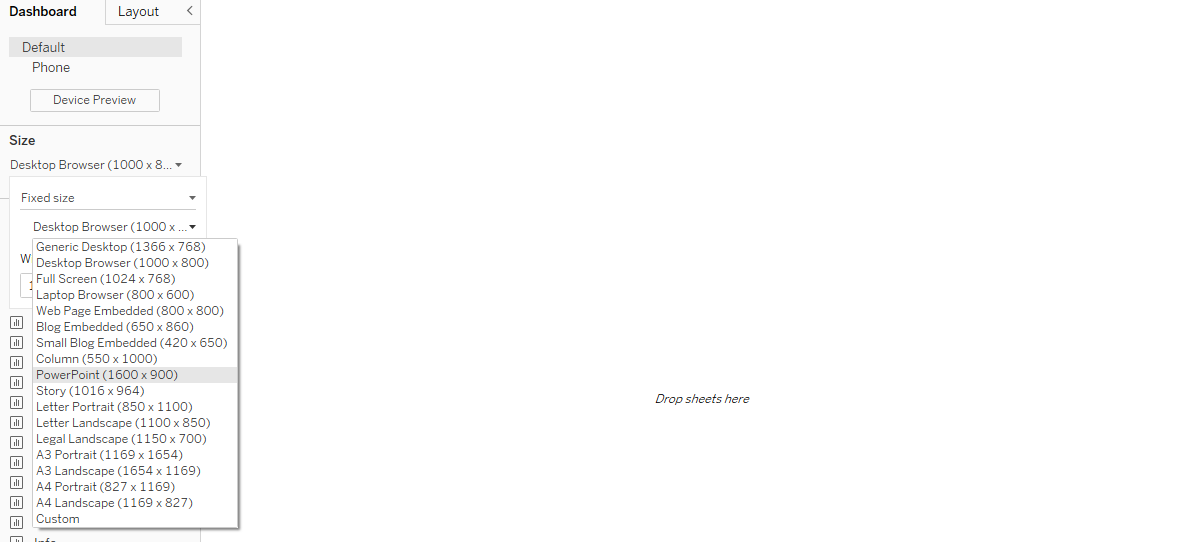
Step 1:
Select your dashboard size in Tableau. For this example we will use 1600 x 900.
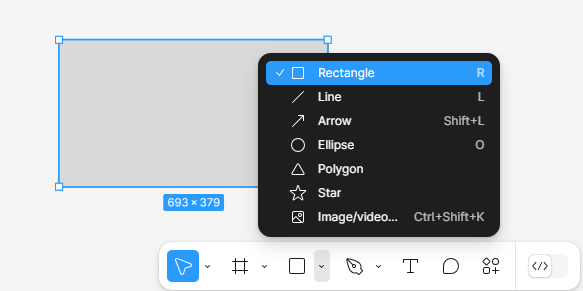
Step 2:
Draw a rectangle in Figma.
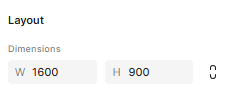
Step 3:
Select a dimension to match your dashboard size.
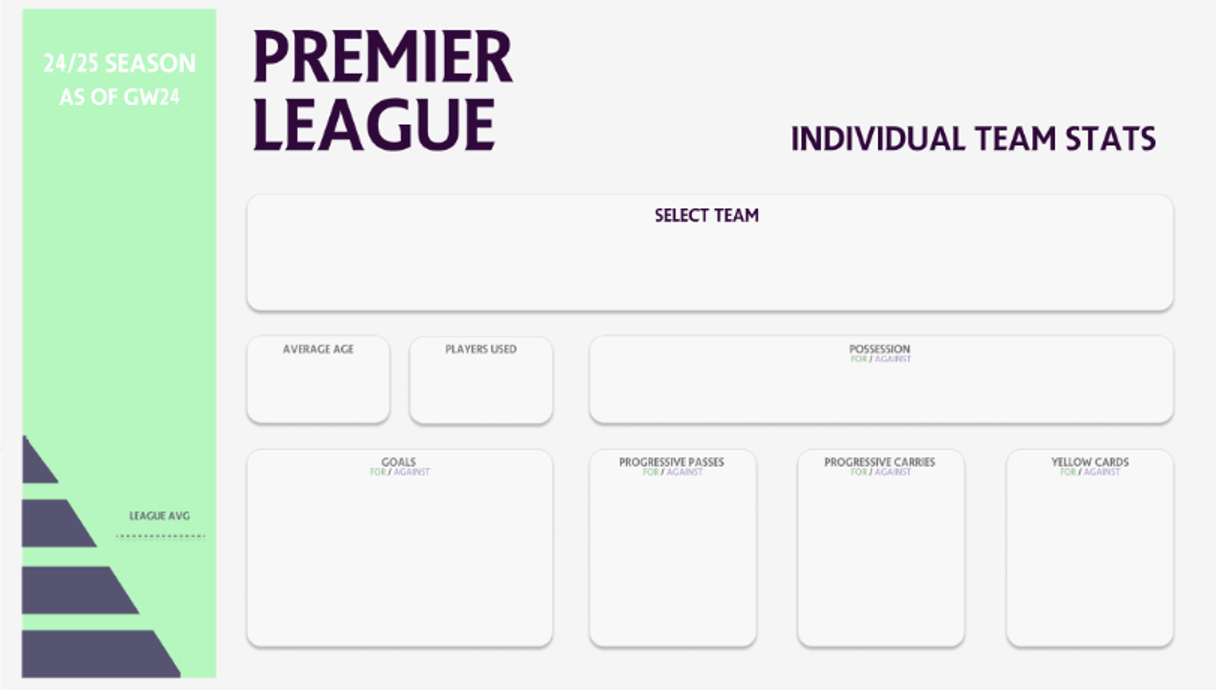
Step 4:
Design your dashboard and export to image.
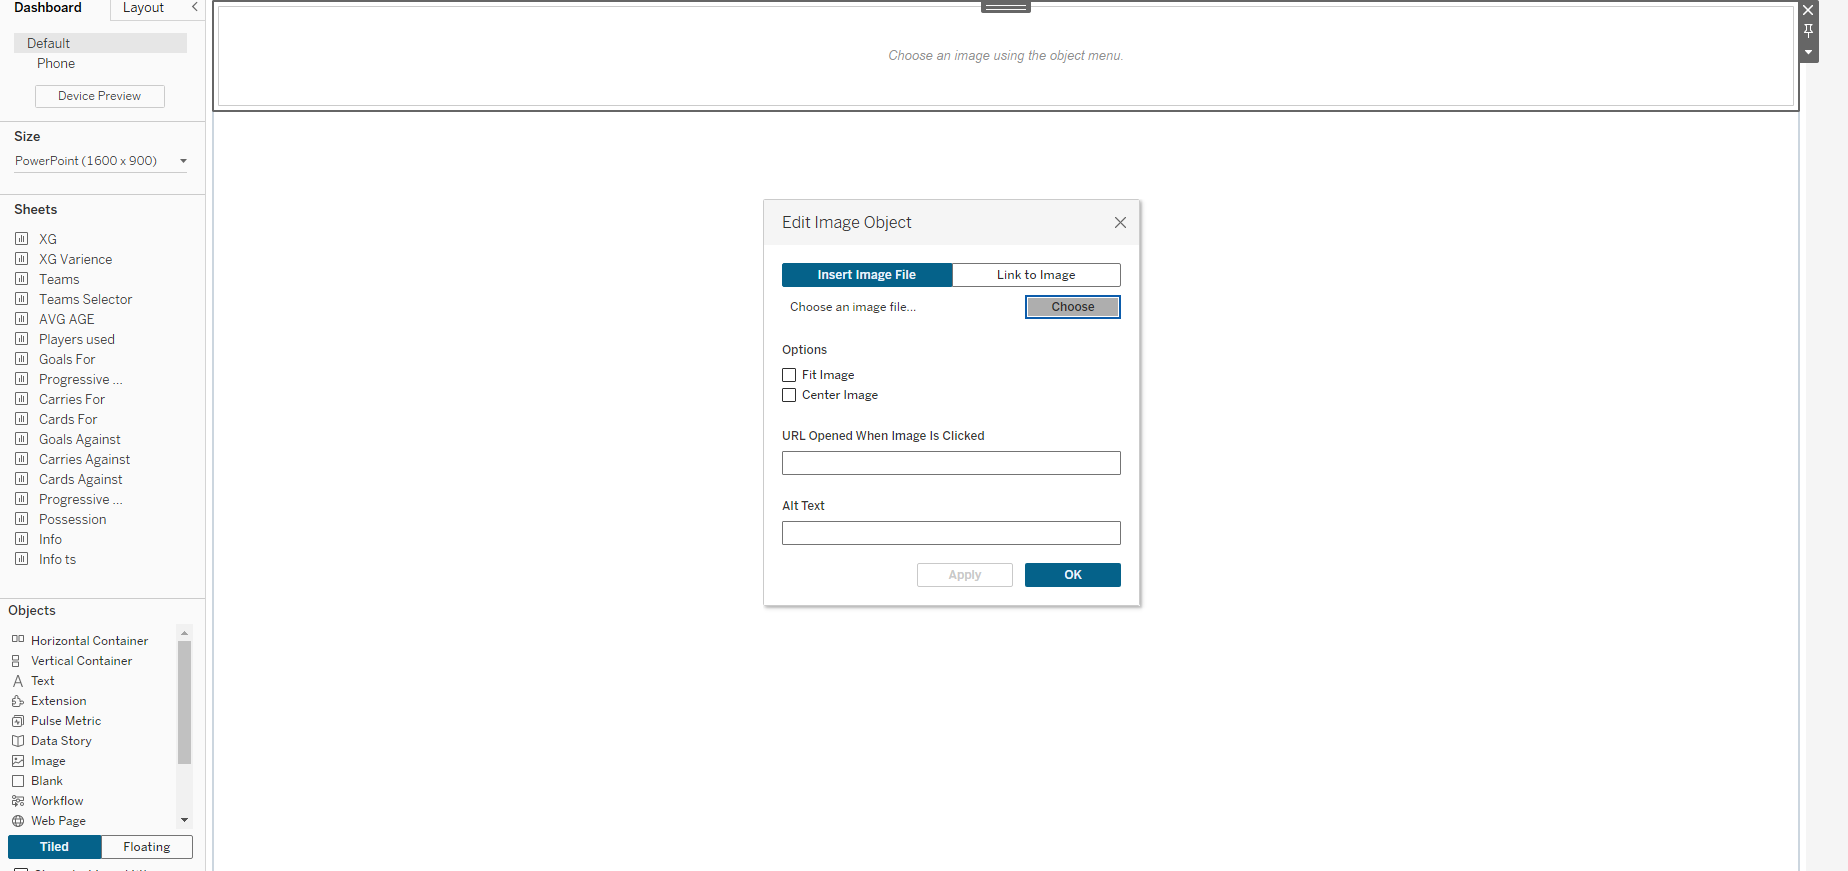
Step 5:
Drag a container on to your empty dashboard and then drop an image object into it. Select your newly designed background. Leave fit image and center image unticked.
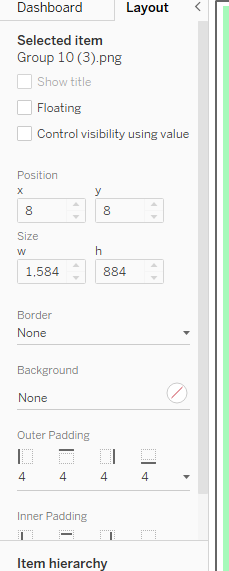
Step 6:
Select your image and remove any padding. Do the same for the container behind it to remove that white trimming.
Step 7:
Add your charts above the background image via a floating container.
Your dashboard is now complete!