


Today we were tasked with converting the dashboard below into an insightful infographic of our choice.
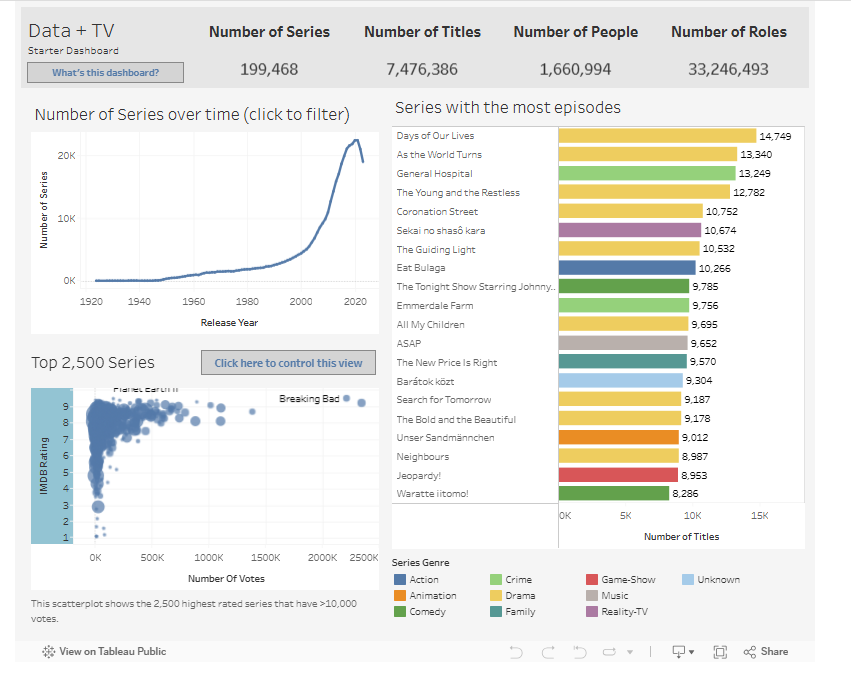
I decided to focus on a particular show, and after discussing with my coach, we decided that it would be interesting to see if one particular character impacts a shows popularity. The show that I based my dashboard off was Peep Show.
Firstly, I wanted to see which actor had the highest average rating across the show. To do this, I compared the % of episodes they featured in that were above the shows average rating:
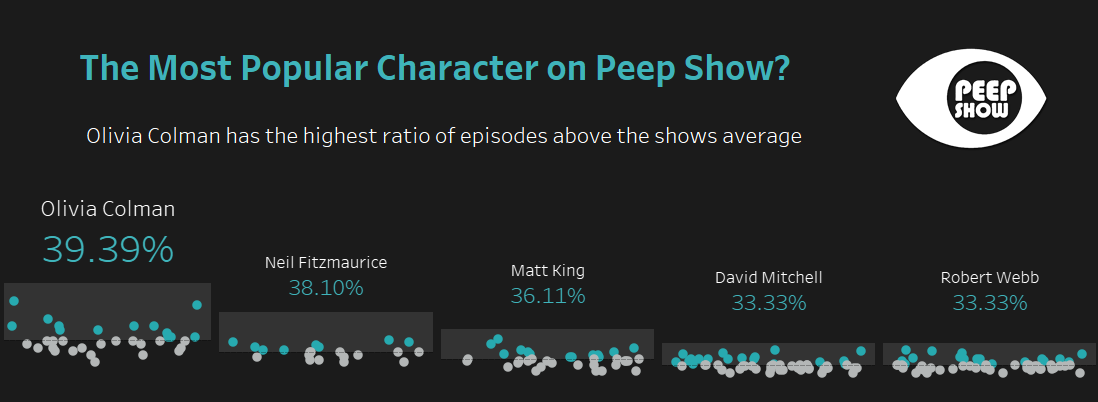
This graph showed Olivia Colman as the shows most popular actor. I then deep dived into her role on the show.
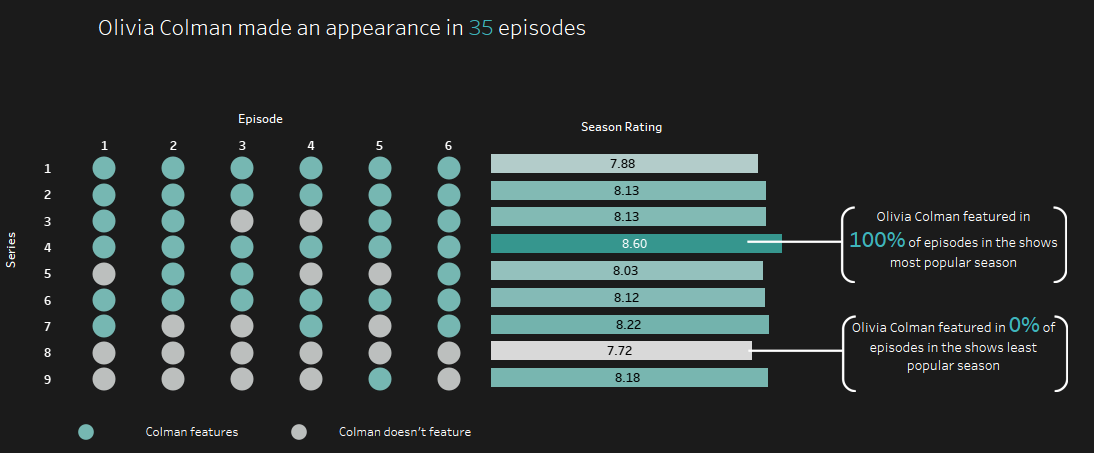
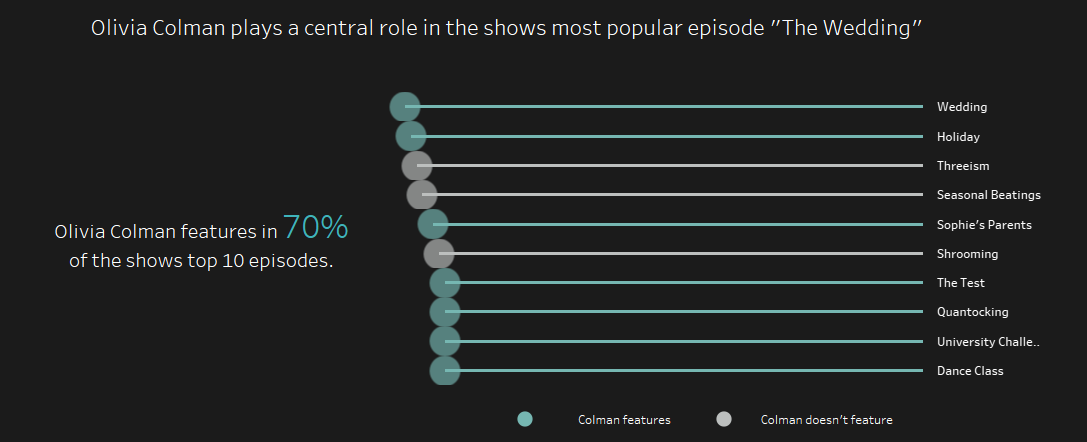
Olivia Colman was a regular feature on the shows most popular season and appeared in most of the shows top episodes. She was clearly a big part of Peep Show's success.
Despite this, in the seasons that she was not a regular on, the episodes without her did not fall in rating.
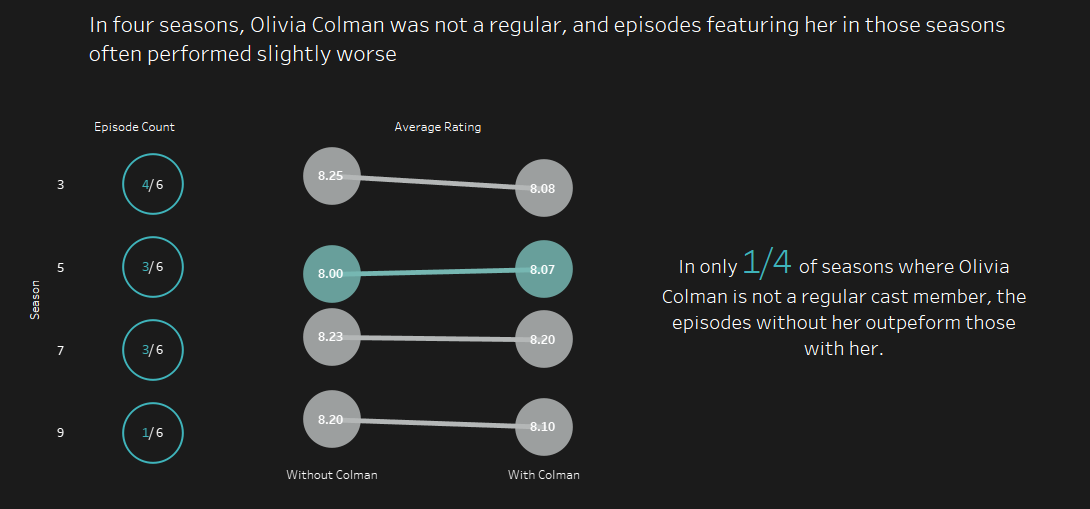
From this, I concluded that although Olivia Colman was an important part of the Peep Show, her presence coincided with the shows strongest period, and she alone was the not the sole reason for the shows high ratings.
If you want to see the finished dashboard please find it here: