


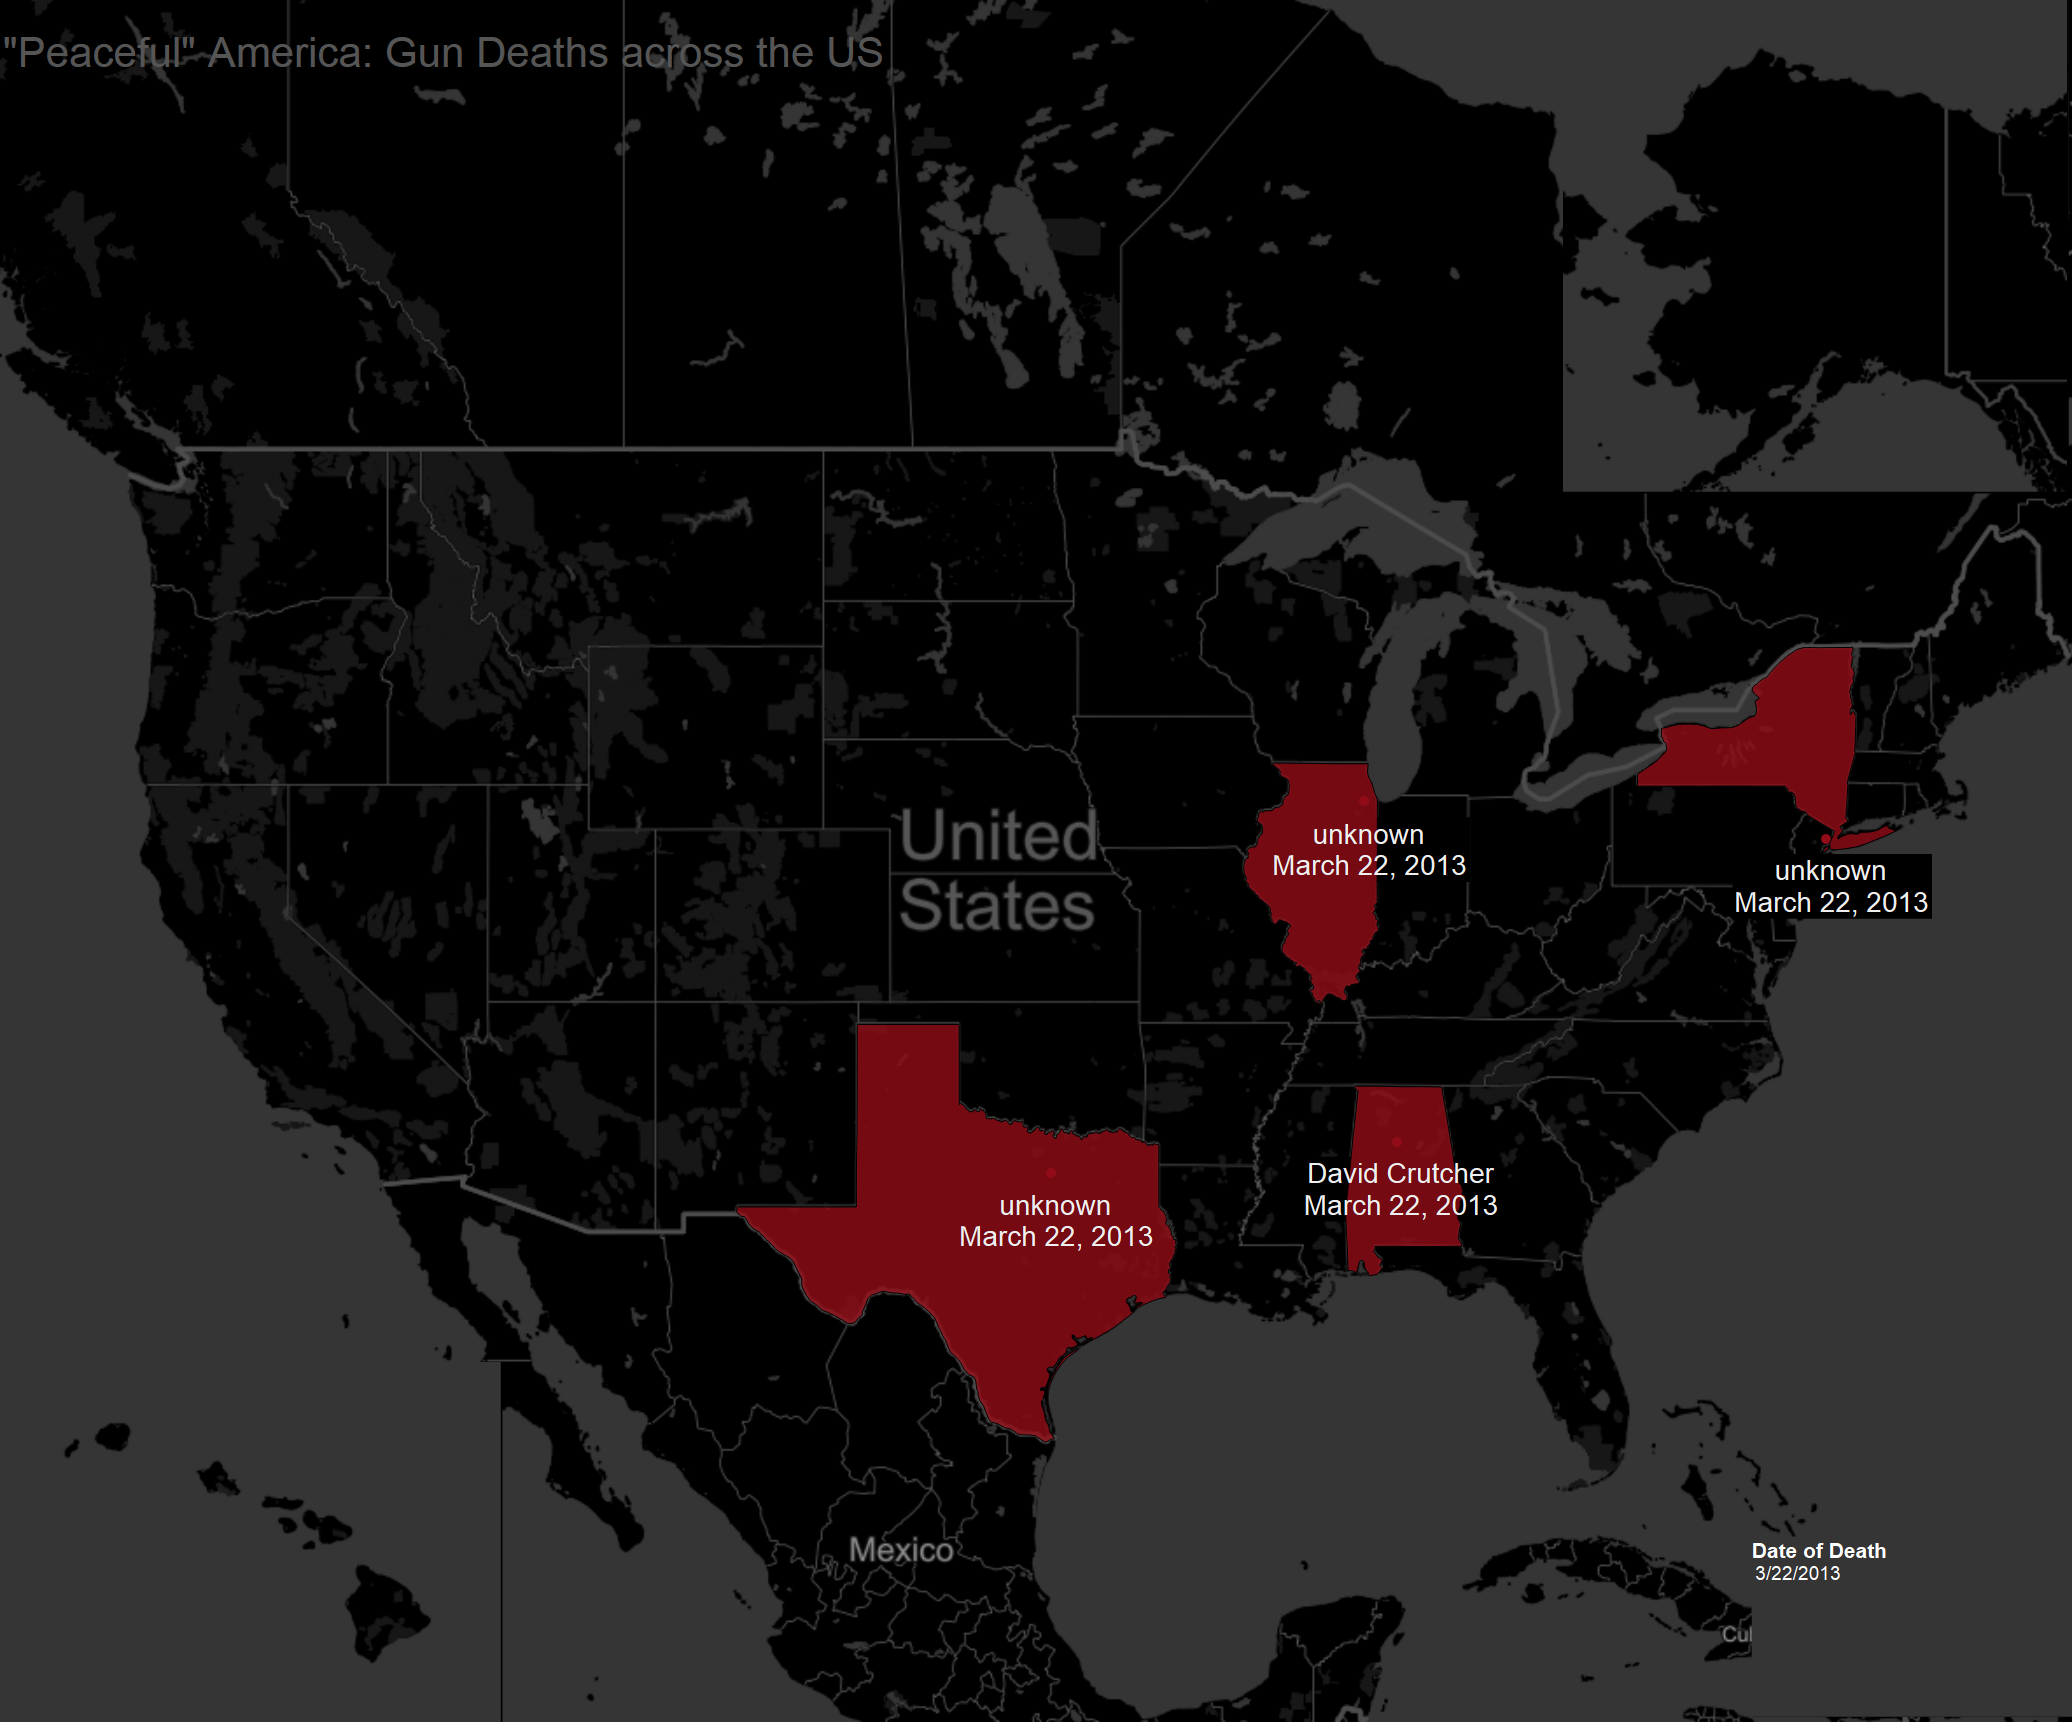
My second daily contribution to this week’s Dashboard Challenge is a remake of a visualisation from the Huffington Post: http://data.huffingtonpost.com/2013/03/gun-deaths It is quite harrowing, but it is beautiful and delivers the message to your brain and to your heart; I had goosebumps while looking at it. So, the challenge was tough, but rather than focusing on improving something already almost perfect, I focused on changing the focus of the viz and in the process, I’ve also learned something new. So here is the final outcome:
It looks different on Tableau public than it does on the version I have hosted on Amazon. The issue was that there is no option for page control in Tableau so, while my idea worked great in Tableau Desktop, it didn’t work so well in Tablau Public. So I have resorted to the Javascript API. The original idea is not mine, I got it from this post: http://community.tableau.com/thread/129772 where I also got the code I modified. The idea behind it is really simple, what the code does is updating a parameter every x amount of time. Here is how I went about it:
- Add the field I would put in the page shelf to the filter shelf
- Create a parameter that loads its values from the field in the filter shelf
- Configure the filter in the condition section with the following formula [Field in the filter shelf] == [Parameter Name]
- Within the I’ve code set:
- The link to your viz
- The size of the box which will contain the viz (I have sized mine by adding 100px in height and width to the size of my viz)
- The interval time
- Start and end point of your filter (so that the refresh knows when to stop)
That was more or less all, the original code in the link is pretty much ready to go, but feel free to reach out and I will share my version. See you tomorrow!