In Power BI it’s simple enough to connect to two different datatables and not have a relationship between them. You can then head into report view and create some charts using datatable A, and some other charts using datatable B. But in a report like this can we use a single slicer to filter across a common field that exists in both datables A and B, or will we need a slicer for each? The answer is, yes, we can by using a feature within Power BI called “Sync slicers”.

Take the data model above with a sales datatable and a commission datatable with no relationship between them. We don’t have a sale ID or common date field that we can join on but both datatables come from the same bike shop and there are likely insights to be gained from visualising them together.
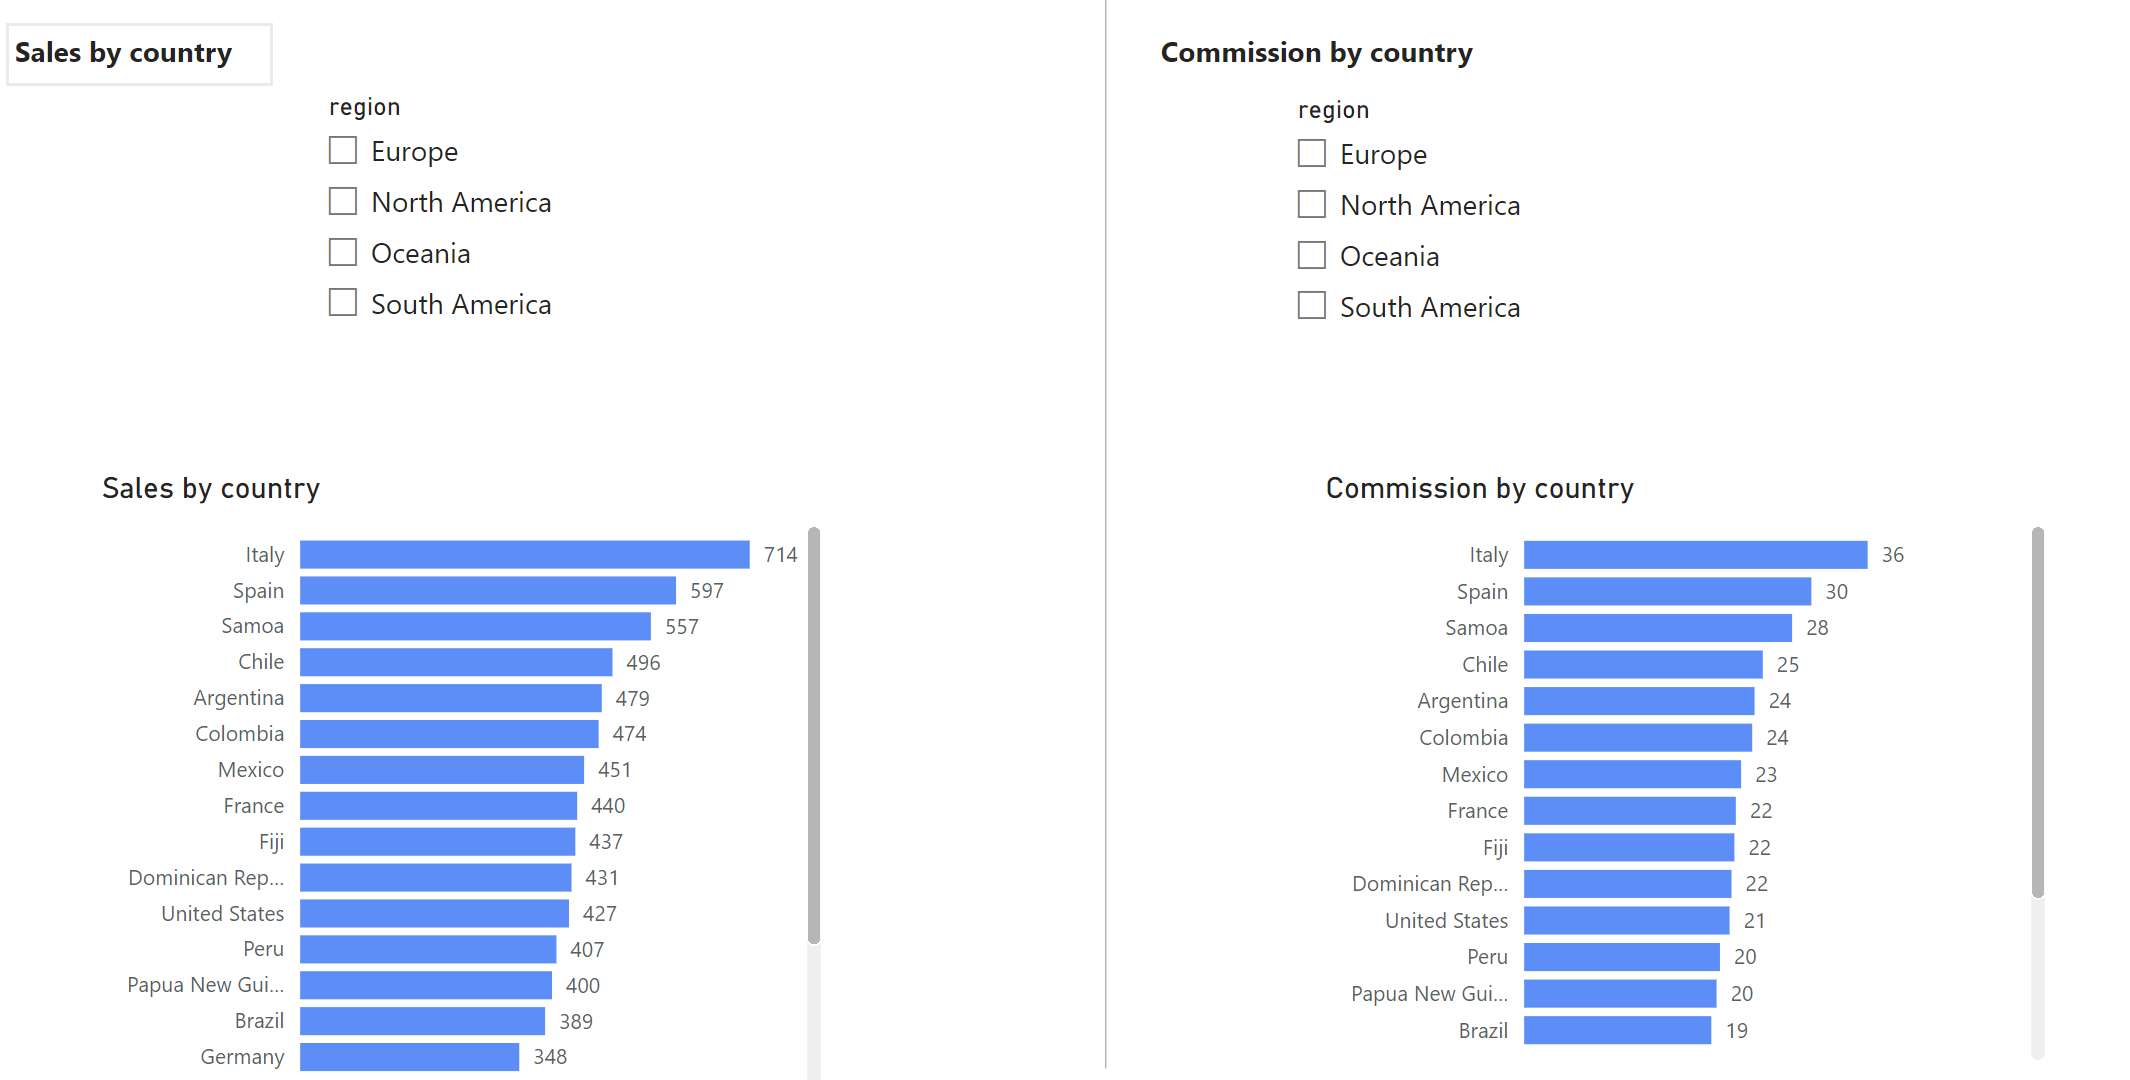
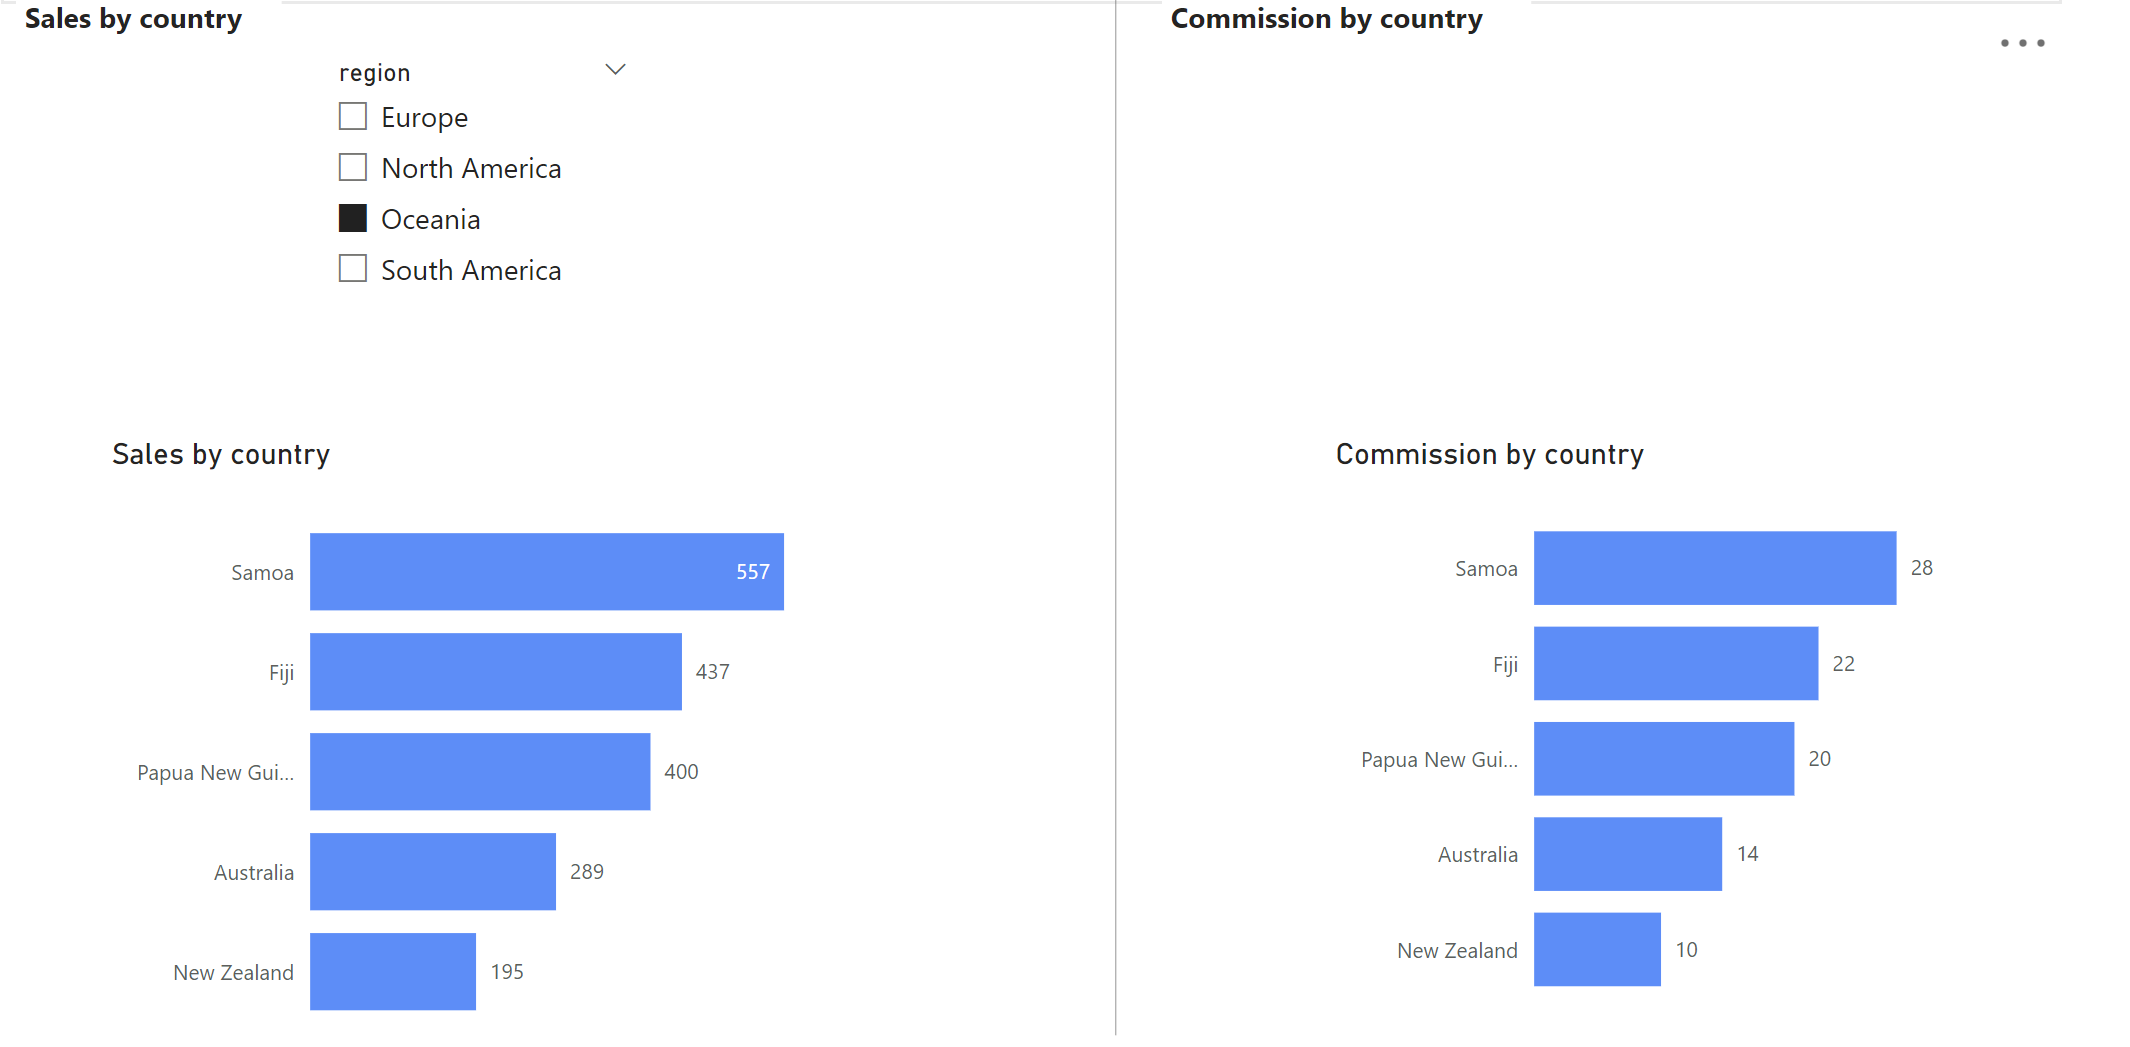
We create a simple report including a sales by country and commission by country bar chart. If we want the end user to be able to filter both of these charts by region we first need to create a region slicer for each as shown above. By default, both of these slicers will exist separately and each one would have to be changed in order to filter both charts. To increase the usability and decrease the clutter we can now utilise the "Sync slicers" feature to link both slicers together so that when the sales slicer is changed, the commission slicer is changed also.
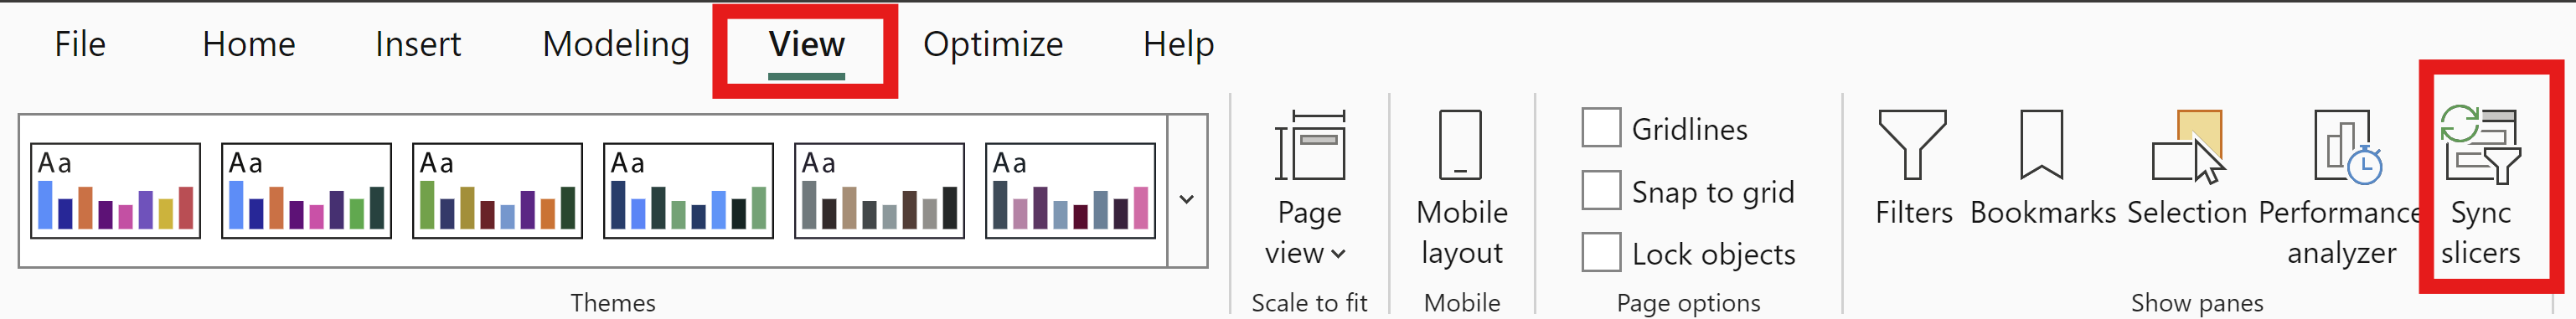
Firstly, we select the sales slicer and head to the "Sync slicers" button within the "View" tab as illustrated. This will pop out the Sync slicers pane and within here we can expand the "Advanced options" window. Here we can name a slicer group that we want this slicer to be part of.
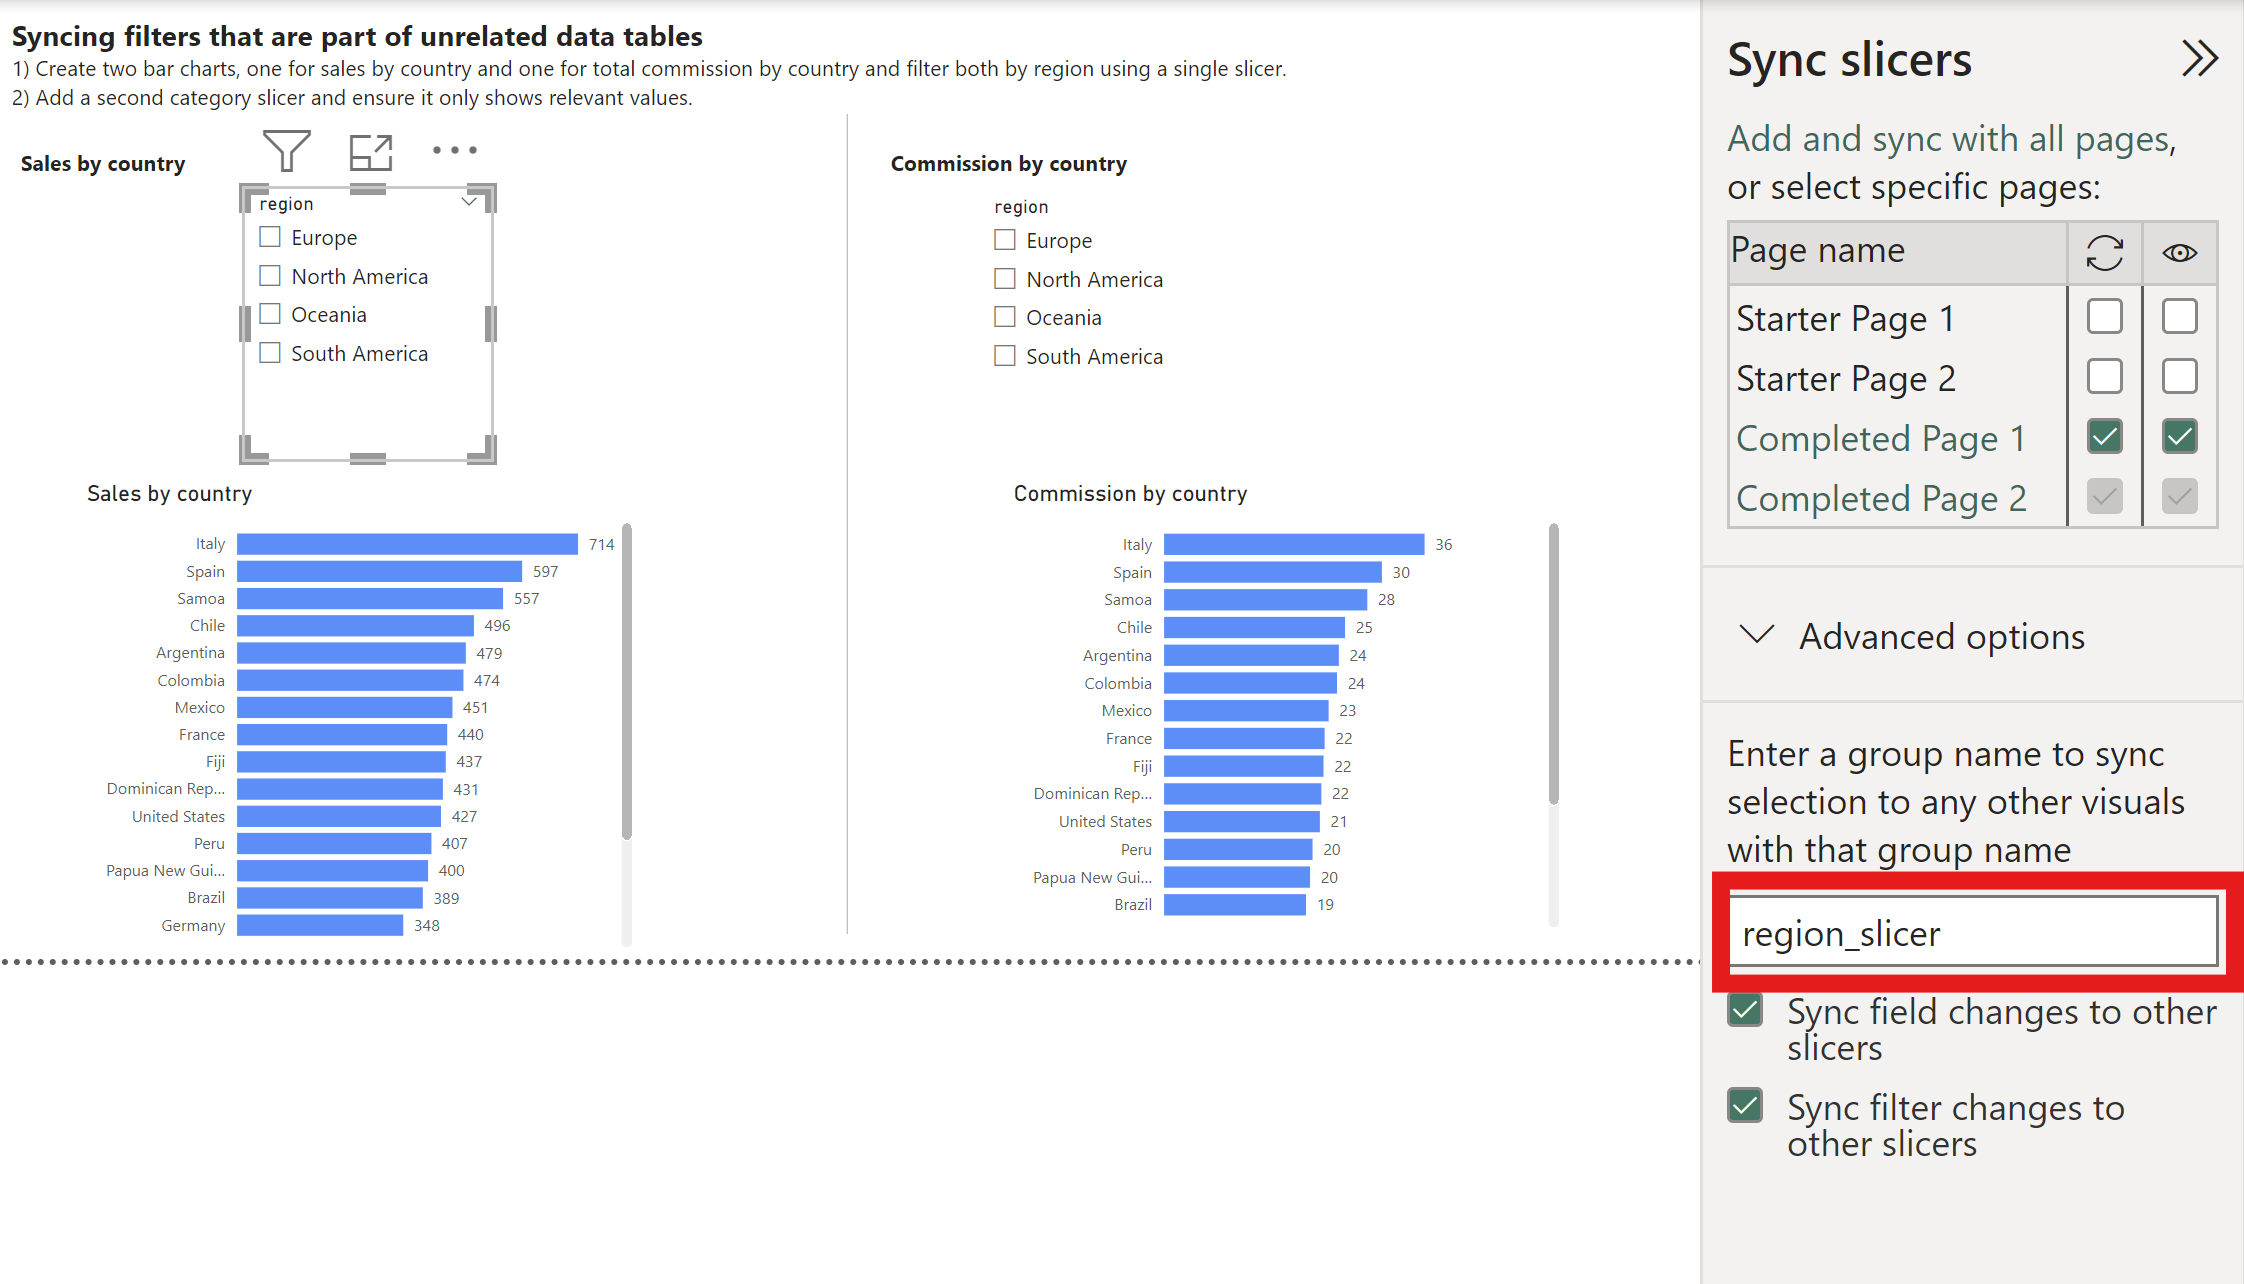
We can then select the commission slicer and also add this to the same slicer group. This can be repeated to any other region slicer and each one will now be linked so that if one changes, they all change. This includes slicers on different pages too.
Finally, we need to hide the commission slicer so that the end-user has a single slicer that filters both charts. It's important to note that we can not remove the commission slicer. If we do this there will no longer be a slicer that filters the commission chart and therefore there will be no slicer to sync to the sales slicer. Instead, we can use the "Selection" pane to hide the commission slicer. What we're left with is a single region slicer that filters both charts despite them being created using unrelated datatables.