Hello Blog readers, this is my fist blog as a Data Schooler and just in general. I’ve decided to pop my blogging cherry talking about Dates in Tableau looking at the difference in Blue and Green pills, the different fields that encompass each coloured pill and the different strengths and weaknesses of them.

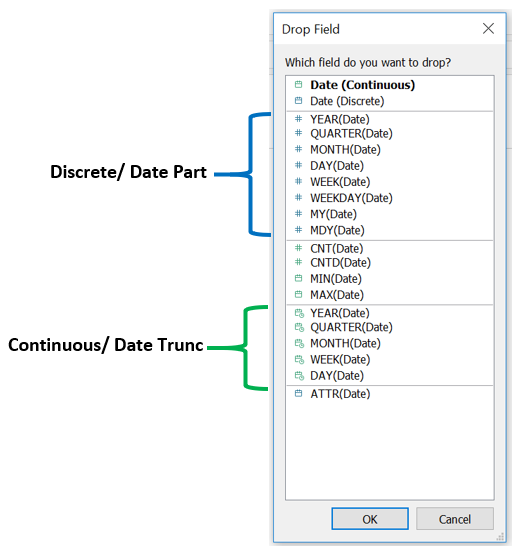
The best practice when using any date in Tableau is to hold righclick then drag the date from the data tab onto your data pane, this is going to open an options menu seen to the right. This menu should make you stop and think about what you’re trying to show with your data. It can really influence which option in this menu is the right one for you.
The top two options Date (Continuous) and Date (Discrete) will show every date that is included in your data set. With the continuous it will create an axis whereas the discrete will have a separate mark for every day in the data. The discrete option it can get very crowded in the axis very quickly and you don’t always need that level of detail to answer your question.
So if you decide not to go with one of the top options what do the others mean and which one is going to be best for you?
Starting with the blue simply because its higher on the list. The blue is referred to as the discrete pill but in dates its better to think about this as a Date part. Selecting any of these will only show that part of the date on your axis.

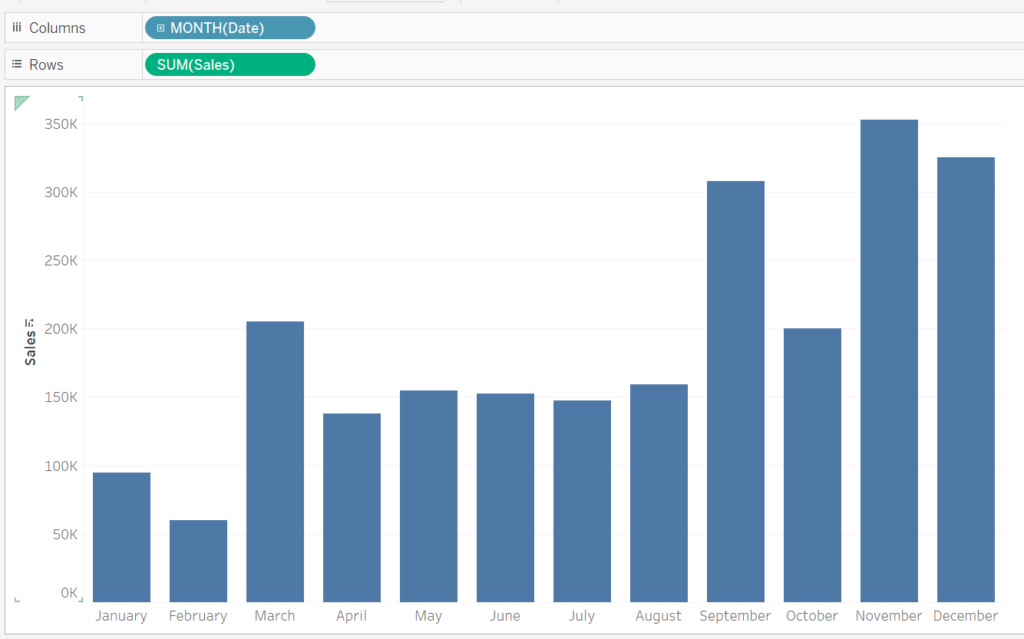
In this example above the Month Date part has been selected. Grouping all the data into each month. Its important to know that if there is multiple years in the data set tableau will aggregate them with the default being summed together. To change how they are aggregated rightclick on the green SUM pill and clicking on measure you will be given several other options to aggregate the date with.

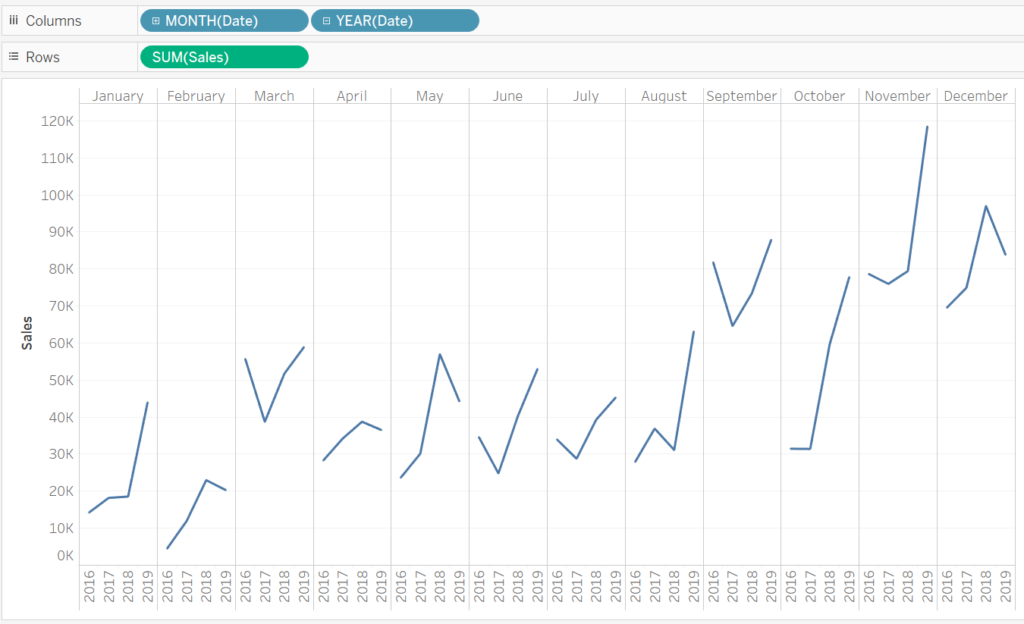
When there are two pills of the same colour the order can be changed around. However if you had a blue and green pill the blue would always be first. With the graph above Month Date part has been put before Year Date part in order to better compare how an individual month has changed over the years.
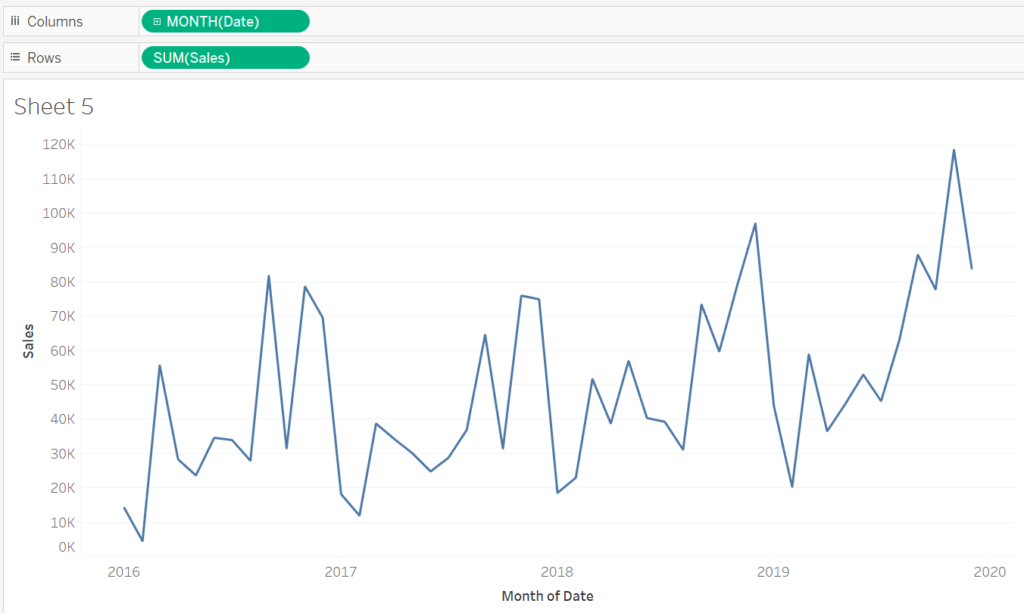
Green pills are thought of as continuous but with dates it makes more sense to think of them as a Date trunc. Tableau will create an axis but will round the data points to a specified level, so selecting the green Month will round the days in the data to 01. Date truncs are much better at looking for changes over time because compared to the Date part month the Date trunc month will create an axis showing all of the years in the data set.

With this example the Date trunc is month so every point on the graph represents a month of that year.
That concludes this blog explaining the basics of the different types of dates that can be utilized in Tableau desktop if you have any further questions or feedback please leave a comment or contact me on twitter @craigstevendata.
