Forgive me Data Gods, for I hath sinned.
We all remember the day we first picked up Tableau. So many tools, so much going on, so little knowledge – all we could do is trumble along and hope not to fall too hard. The results were amateurish, but they were hard fought.
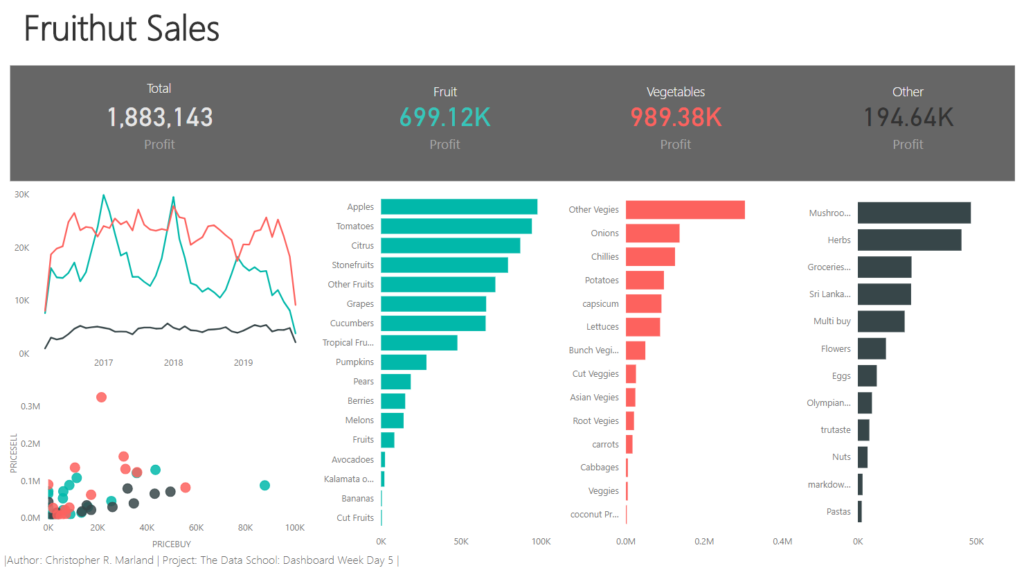
Today I produced a viz that took me right back to the beginning, because I did it in PowerBI.
Downloading the data was pretty easy, there wasn’t much to it. A big change from the usual stress and effort involved in downloading data during Dashboard Week – the bigger challenge was downloading PowerBI!
Luckily, deep in the archives was an install package, because Microsoft Store just wasn’t letting me download it.
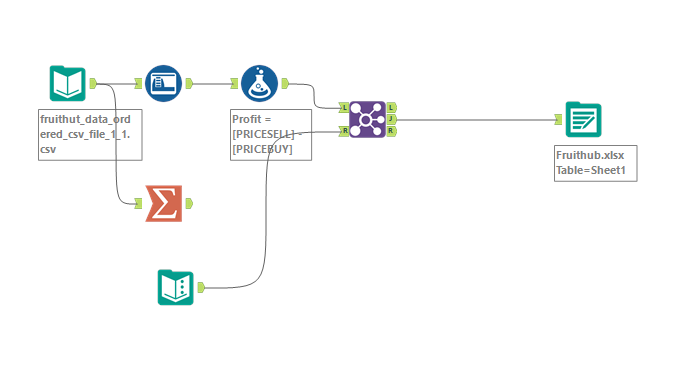
I’m not sure whether PowerBI has an equivalent to calculated fields, but I tried several methods and couldn’t find anything satisfactory and so I ended up just using Alteryx to do anything calculated field-y.

In some ways, using PowerBI was much easier than using Tableau in terms of designing charts, the only issue is that it becomes easier because PowerBI makes a lot of assumptions about what you want to do with your charts.
Nevertheless, I produced something…

Hopefully, the Data Gods will forgive me.
