


Today I was down to teach the public at one, meaning I only had 3 hours to download, prep and visualise today’s data. And to make matters worse…we had to do it on this ancient piece of software called Tableau 8.3 that they apparently used in the olden days.
Downloading was…actually quite easy. Andy told us not to all download it at the same time, so, naturally, we ignored him and downloaded it all at the same time. But today we only had a measly 630,000 rows of data – child’s play!
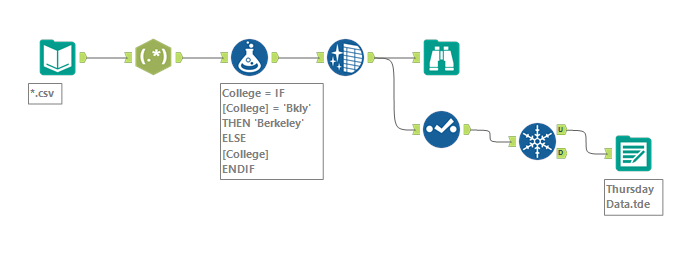
Data prep was relatively simple, I even got to use a cheeky bit of RegEx today, my two-month long love of my life.
Vizzing was the hard bit, apparently DS1 used this interface every day.
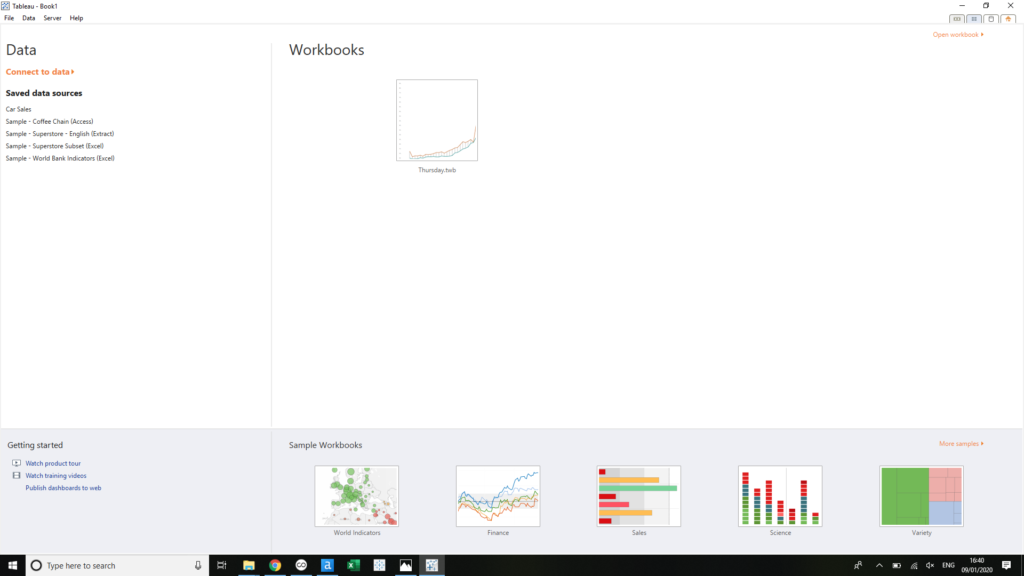
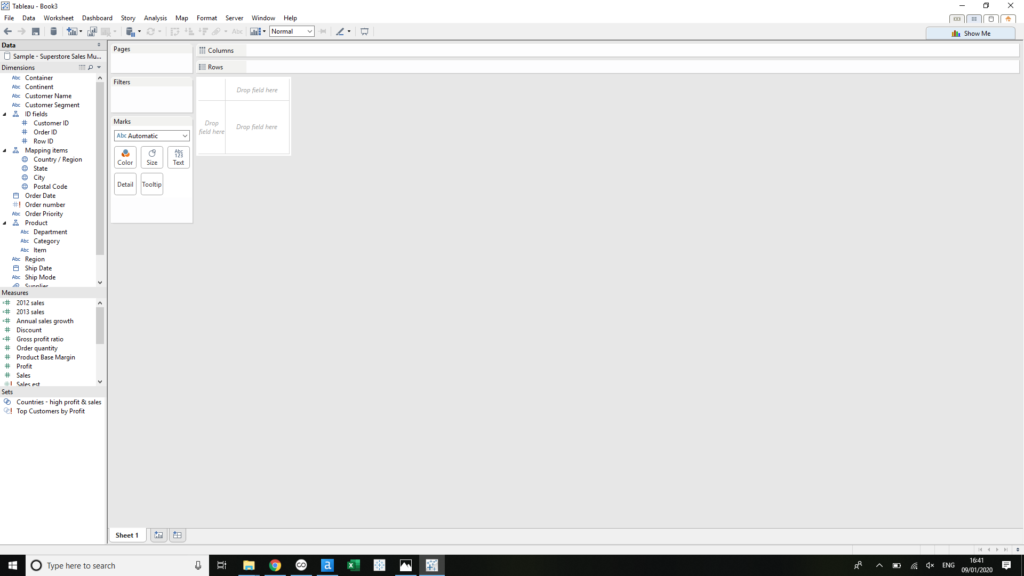
Tableau 8.3 also doesn’t allow LODs, which was a problem when I wanted to recreate this.
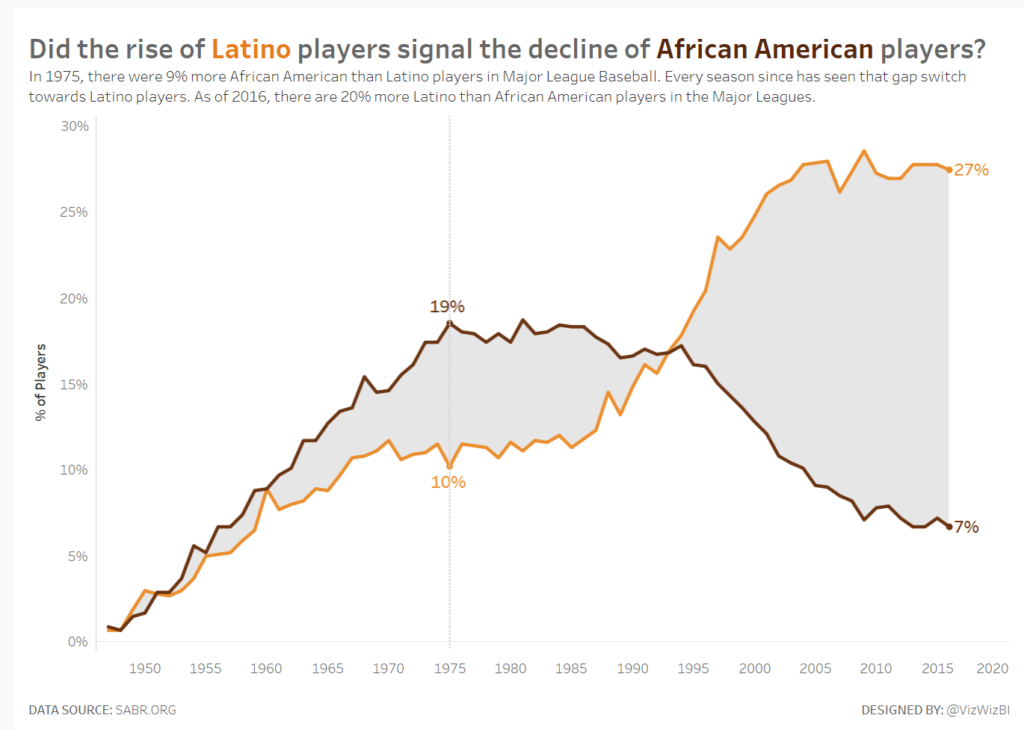
Instead I had to settle for lines between them, which I did with the following calcs:
1 – Men IF [Gender] = ‘Male’ THEN [Number of Records] ELSE Null END
2 – Women IF [Gender = ‘Female’ THEN [Number of Records] ELSE Null END
3 – Difference COUNT([Men]) – COUNT([Women])
I then used a dual axis chart, where the difference calc was used to size Gantt charts placed over the line chart.
And this was my end result:
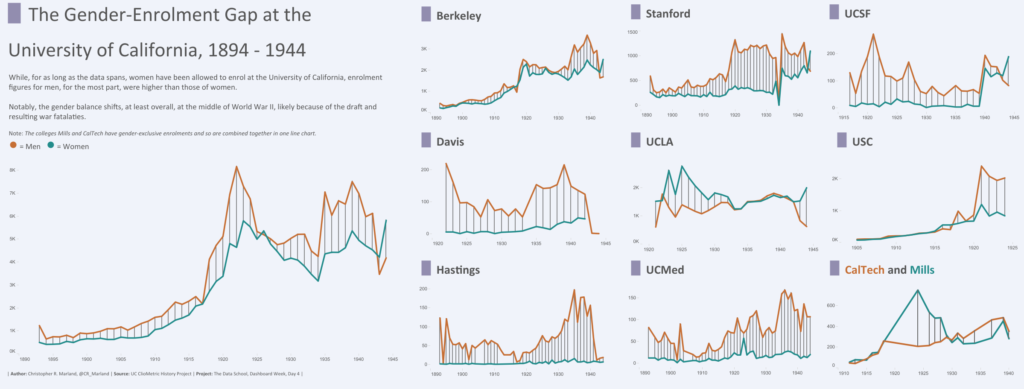
Who needs shades when you can have thin wee lines, huh?