


This week was once again varied in content, with a rare PowerBI Client Project, learning about accessing APIs and Web scraping, plus the opportunity to see how a day as a DS consultant on placement looks.
Alteryx API & Web Scraping
API stands for Application Programming Interface, and we use an API to access information on a server, we can access the data in the format of JSON, CSVs or otherwise. Normally they come with documentation of how to use the API key to access the information on a website.
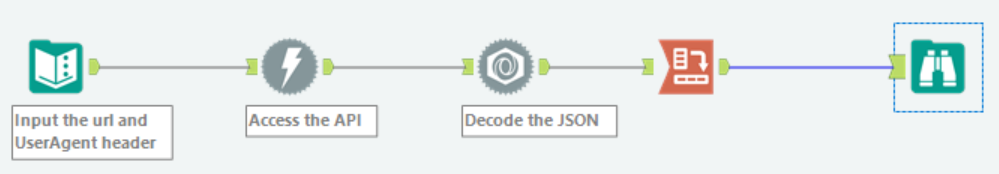
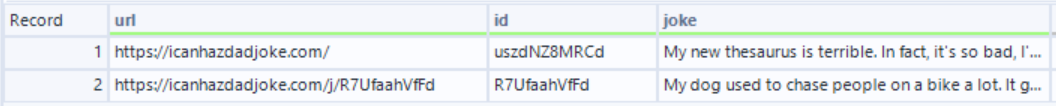
In the below example we accessed a site that provides dad jokes. Thankfully the website had clear documentation which made accessing the information relatively straightforward, once the steps of the process were explained to us. We later moved on to accessing the Spotify API, which provided a fun opportunity to learn about APIs. I use a website called Last.fm to track and gain insights about my favourite albums, artists and tracks across time. Working through the basic example of accessing information about the artist and their genre provided insight into an application that I use on a regular basis, how the site pulls information to display. If you would to learn how to connect to an API and extract information, here is a blog explaining how to.
Web scraping proved to be a far more difficult endeavor than the APIs. Especially because different websites will have their HTML written in different ways, and delineate the sections differently, it makes it a much more time consuming process that does not have a one size fits all solution (I know that practicing how to read structures and understanding common patterns will make this process much easier as time goes). The process is similar in using a text input tool for the URL and then a Download tool to obtain the HTML code of the webpage into a cell. Afterwards, you can breakdown the HTML code into multiple rows after each line break, and browse the code next tot the web page to try and identify patterns to extract the data you want from the webpage. Through the use of Filters, RegEx and other tools such as CrossTab to get the data into a desired form. If you would like to learn more about how to web scrape in Alteryx, click here.
Shadowing
Shadowing was a great way to gain insight into the day to day of a consultant out on placement. With less than 2 months until training is over, learning about the structure of a day and some of the challenges I may face was useful, and will shape my approach when going on placement. If you would like to read more about my experience, click here.
Client Project
This week's project provided an opportunity to strengthen our PowerBI skills (which I have been trying to keep in touch with by doing Makeover Monday's in the software). The project focused on building a report to analysis an individual and track their performance over time, whilst picking up areas that they excel or lag behind their cohort in. Another report focused on comparing the cohort against other individuals in the same group, showcasing their performance on various metrics. I focused on building a chart that featured on both. It visualised the pre-defined key metrics by the client, of which there were 12. One version had the ability to select 2 individuals to compare each of their performance within a period of time for the cohort analysis. Another version for the individual report had a bar graph linked to the chart, which was colour coded in a traffic light style to call out any metrics that were either a standard deviation above or below the rest of their cohort.
The week proved to be stressful for our cohort, as coming up with some unique charts for a project we were very excited for were brought back to reality with the limitations that PowerBI comes with, including for the custom visuals. However, by the end of the week we were satisfied with what we had produced and the client was happy with some of the insights we were able to provide with the reports. Afterwards, as a collective we were able to provide suggestions that would aid in the process of streamlining the data preparation process, and being able to help the managers that may not see the value in data analytics for their position and get on board with the data analytics department.
Next Week
Our last client project before a week break should be exciting, and our first lessons on SQL!