


Alteryx contains many useful tools to enable predictive modelling and analysing. It describes the correlation between one dependent variable and one or more independent variables.
A well constructed regression model will minimise the sum of the residuals, and use the R2 to measure how much of the variability in the dependent variable explained by the line of best fit. (Residuals are the difference between the best fit values and actual values). Normally you would seek a higher R2 as this means the predictions are close to the actual values. If you want to find the causal effect of one or more variables in relation to another, you can investigate this relationship.
Setting up a Linear Regression
For this example we are going to be using data on penguins in Antarctica to investigate the relationship between flipper length and penguin mass.
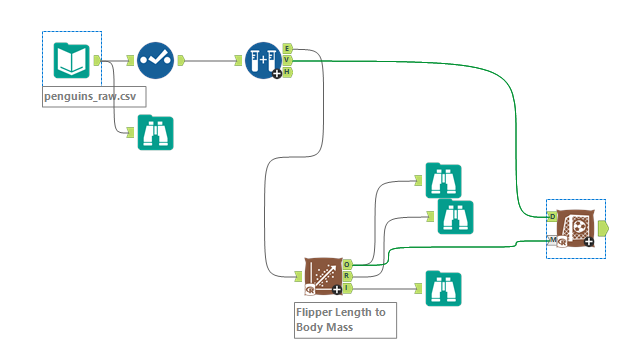
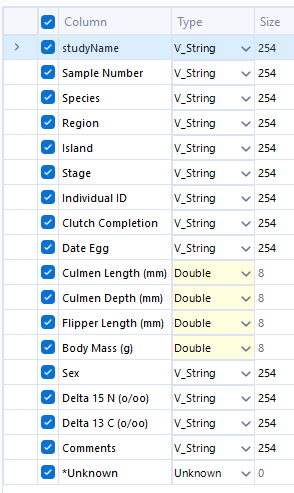
- After inputting the data, we drag a select tool to ensure the fields are the correct data types. As they are currently incorrect, we adjust the fields "Culmen Length, Depth, Flipper Length and Body Mass" to be the double data type.
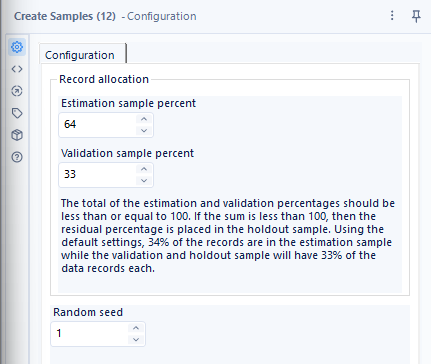
- After this, we introduce the Create Samples Tool, which helps to take a random sample of rows for the estimation. This ensures the sample is representative of the population data, and allows for more reliable inferences. For this test, we set the following parameters. This specifies the percentage of rows that are desired in the estimation and validation samples.
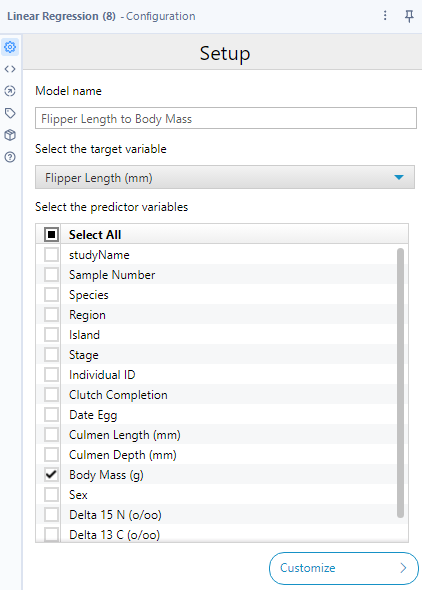
- Dragging in the Linear Regression tool, we use this to evaluate the relationships between variables based on a linear relationship. After naming the model, a target variable (or dependent variable) of Flipper Length is selected. The predictor variable (independent variable) of Body Mass is selected.
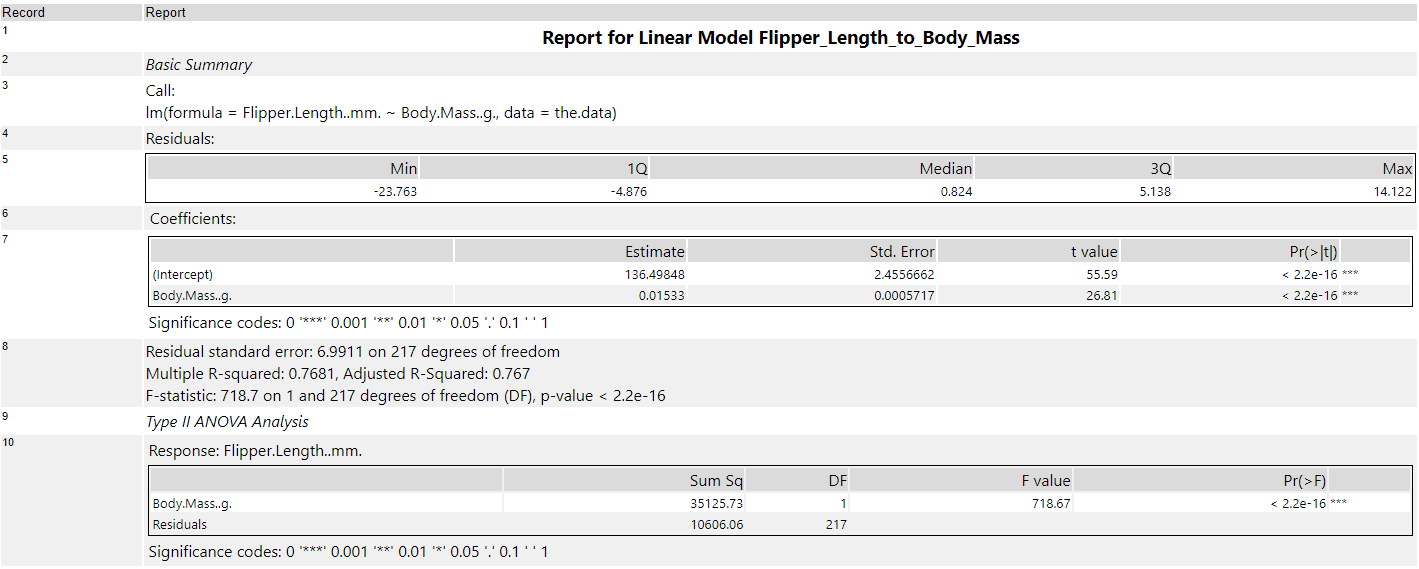
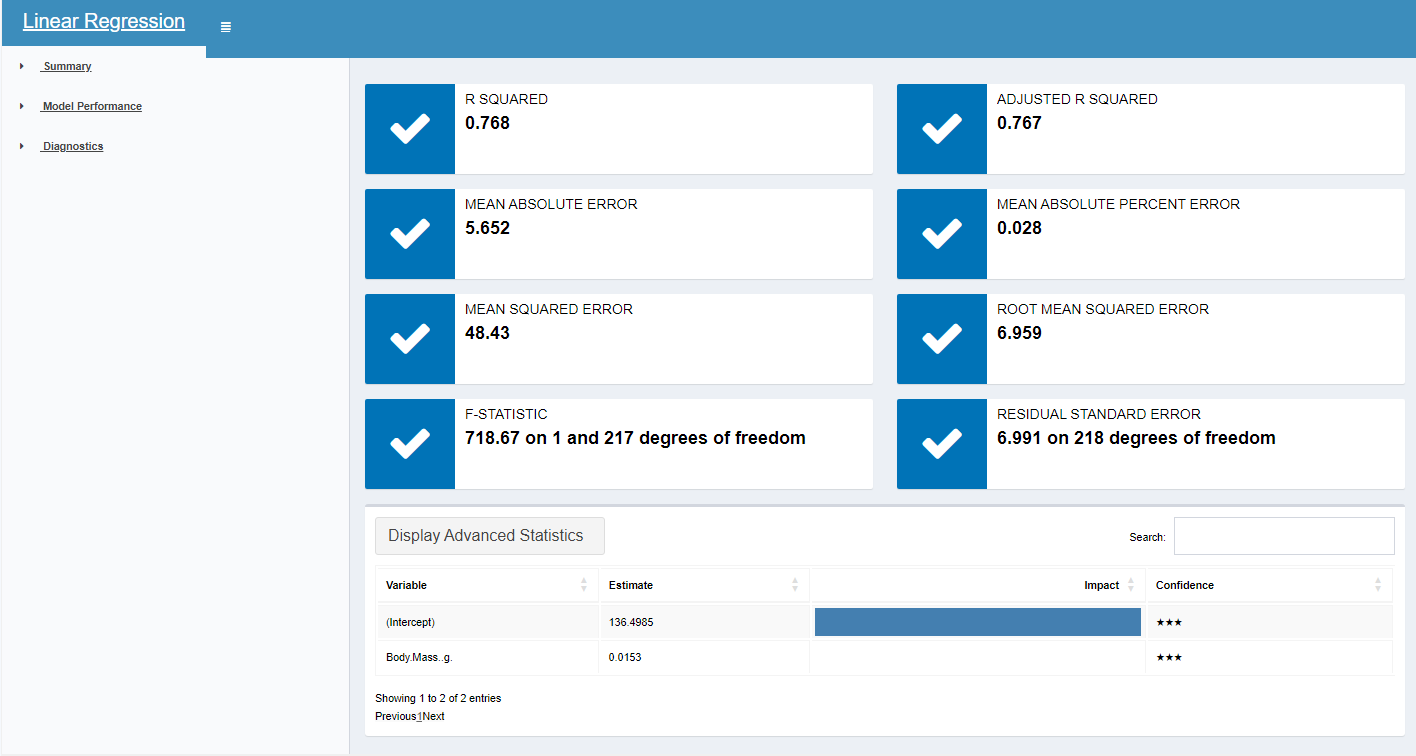
Viewing the output can be achieved by attaching a browse tool to each of the output anchors. The Output anchor displays the model name and size of the object in the Results window. The Report anchor displays a summary report of the model that includes summary and plots. The Interactive anchor displays a dashboard of interactive visualisations for data discovery.
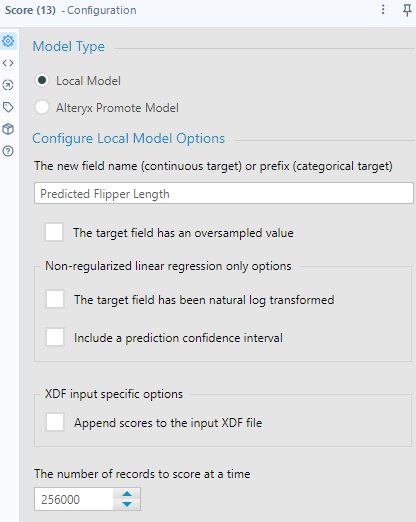
Finally, a Score tool is added, which creates an estimate of the dependent variable by applying and R model to a set of the independent variables. If the independent variable is categorical, it gives probabilities that a record belongs to each category. If continuous, it estimates the dependent variables value.
The inputs required are a model object produce by a predictive tool (the O anchor of the Regression tool) to the M input connector, and then a data stream that contains the predictor fields selected (V output from the sample tool to the D input). The configuration panel is simple in this case, as we will use the Local Model. We add a new name for the field name as "Predicted Flipper Length".
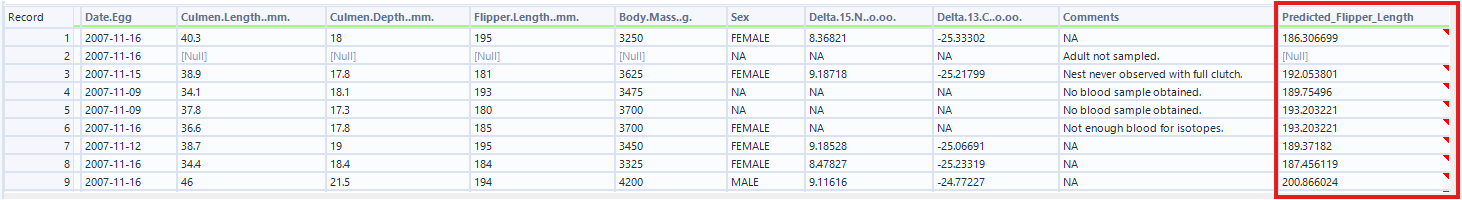
In the output, we see the Predicted Flipper Length added to the dataset at the end.
In future...
You can add other tools and tweak the model to perform different types of analysis. For example, comparing totals by using a summarise tool, or creating multiple branches with different parameters. The results can then be combined and compared once named with a Formula tool. The possibilities are endless.