What are all these blogs about one dashboard? Check out the introduction blog here.
Introduction
In this blog I am going to introduce how you can create a button that when pressed, updates a parameter using a parameter action on a Tableau Desktop dashboard.
Why make them?
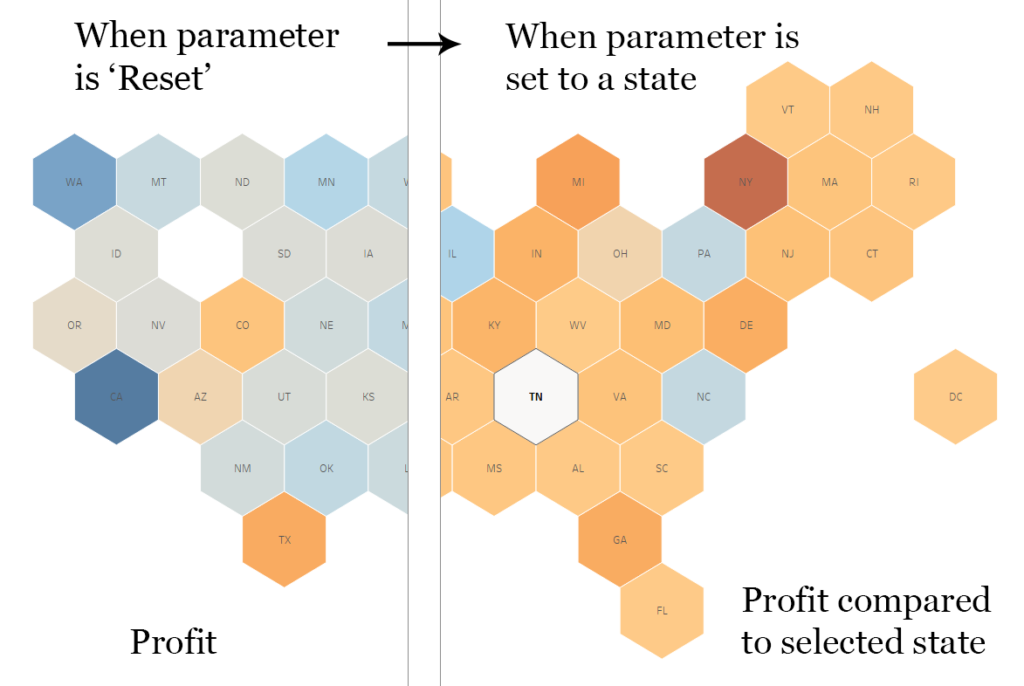
For example, on the demo dashboard for the blog series, there is a hex-map that has a feature where if you select a state, then the view changes based on the selection. The state value is passed into the parameter used and will stay there until it is updated by something else. There is no mark on the view that represents this ‘reset’ value and so there is nothing to select to update the parameter. This leads to an issue where the selection is never removed and the view would never ‘reset’.
A button can be used to allow the user to update the parameter and remove the selection, resetting the view to how it was before the first action.
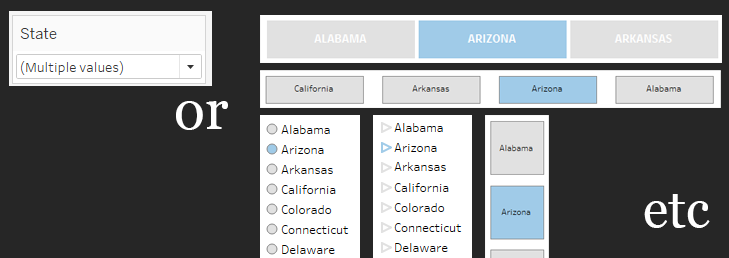
Another reason to use buttons to update parameters, is creating intuitive dashboard functionality. Many parameter drop downs can be replaced by this kind of button adding aesthetic value and simplicity to the view.

How to make button-based parameter actions
- First of all, you need a parameter
- Create a worksheet with mark(s) containing the value you want to pass into the parameter.
- Create a workbook/ dashboard action that will set the parameter equal to the value
1.
Click the drop down in the dimensions pane.

Select ‘Create Parameter’

Give it a sensible name and configure the properties of your parameter. Let’s say we want to use the button to select certain states and in this case, we want a parameter based on states. This will be a string field, allowing a list of values that are based on the field ‘State’ (Superstore dataset info here).
2.
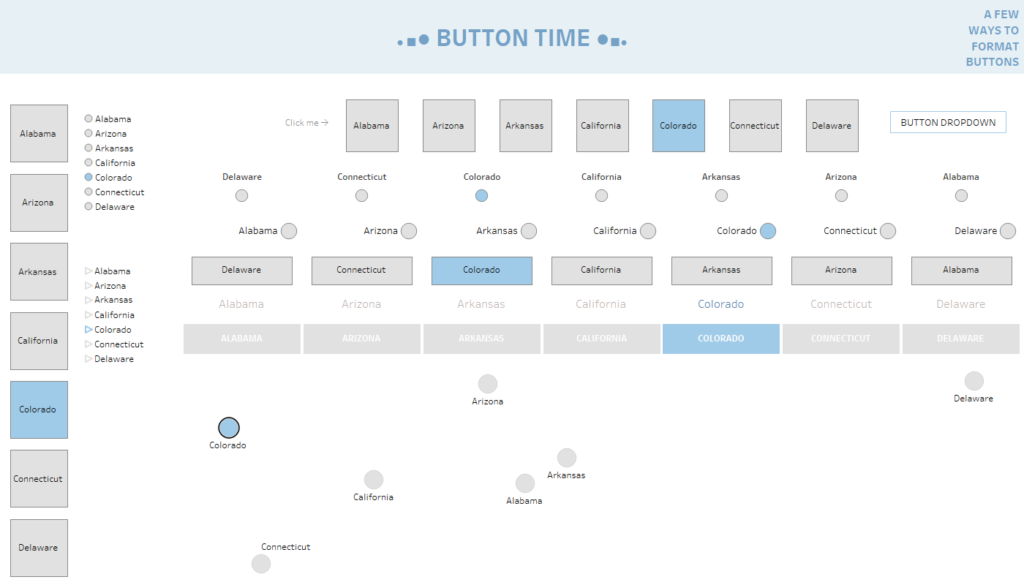
To create the button itself, there are a variety of methods. I have created a dashboard showing different kinds here based on states. You can download this workbook to see their construction, but they are largely some variation of a list of states (rows or columns), with some shape attached to it and the name of the state. Each mark contains information on a state (i.e. the California button has the word ‘California’ in it which can be passed to a parameter later).
Make sure the data type of your parameter and the information you want to pass into the parameter are the same to avoid issues later.
Another kind of button which has been quite useful to me is a ‘reset’ button (as mentioned earlier and as in the demonstration dashboard). To do this we just need one mark with the string ‘reset’ contained in it.
I will show you how to construct this one.

Start a new worksheet and double click in the white space of the marks card to start an ad-hoc calculation. Create in there of ‘reset’ (i.e. just type ‘reset’ including the quotation marks). Any marks we now create will contain the string ‘reset’, which is what we want to pass into the parameter ✔.
Now create a calculated field of min(1)

Set it to be a decimal number

and then put it on the columns shelf of your worksheet. This will create a bar that is 1 long. Set the axis range to fixed and from -0.01 to 1.01

Hide the axis header (right click on min(1) pill) and move the ‘reset’ string from earlier to the label on the marks card. It should now look a little something like:

You can then format it however you like. I went for a light grey as a colour and a slightly darker grey as the border and here we have it:

3.
Action time. After you have added your new button to a dashboard, you can set up the dashboard action to send this ‘reset’ value into the parameter. Give it an appropriate name. Select the sheet the ‘reset’ value is coming from. Run action on select (probably best). Select the target parameter (this is the parameter that you want to change with the reset button). Then finally select the field from the sheet you have selected to get the value from to put into the parameter (in this case it is our string ‘reset’).

And there you have it. A reset button on a dashboard that when selected, sets a parameter to ‘reset’. You can then use this however you like to change your view.
What did my ‘reset’ value actually do to my dashboard?
I had a calculation on the colour of my map. When the parameter was set to ‘reset’ (the default value), it showed the profit for each state. When a state was selected however, it would show how the profit of each state compares to the selected state.

The calculation for which is shown here:

To select a state for the comparison, I have a parameter action set up to set the parameter to whatever state gets clicked on. But, to clear a selection you can’t just click it again (well, Lindsey of http://www.lindseypoulter.com/ may disagree with me there) and so this is where the reset button comes in. It essentially clears the selection, resetting the view.
Conclusion
Buttons and parameter actions are great friends of each other, and the use of these features can really help us create intuitive dashboards. These buttons can also open up great avenues for interactivity and features built into a dashboard. What are you waiting for, give them a go!
Thanks for reading my blog. Any comments or feedback is very welcomed. Also, did I miss something?? Could I do something a better way? Please let me know
Comment below or reach me on twitter @chris_vizes

