


Tableau categorizes fields by whether they are measures or dimensions OR discrete or continuous. Understanding the difference between these categories can help you build more effectively in Tableau.
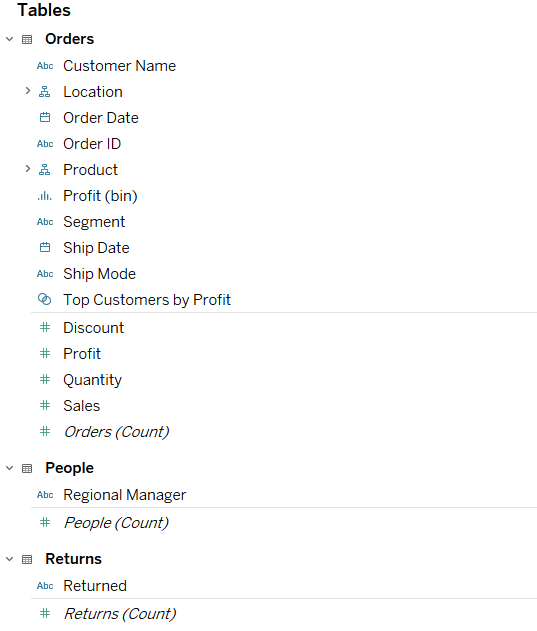
Take a look at a snip of the data pane below from the Sample - Superstore dataset. Can you distinguish between measures and dimensions? Can you tell whether the variables are discrete or continuous? (Hint: green and blue do not correspond to measures and dimensions)
Understanding how Tableau categorizes these variables is important because it determines how the program plots these fields.
Take a look at the two snips below.
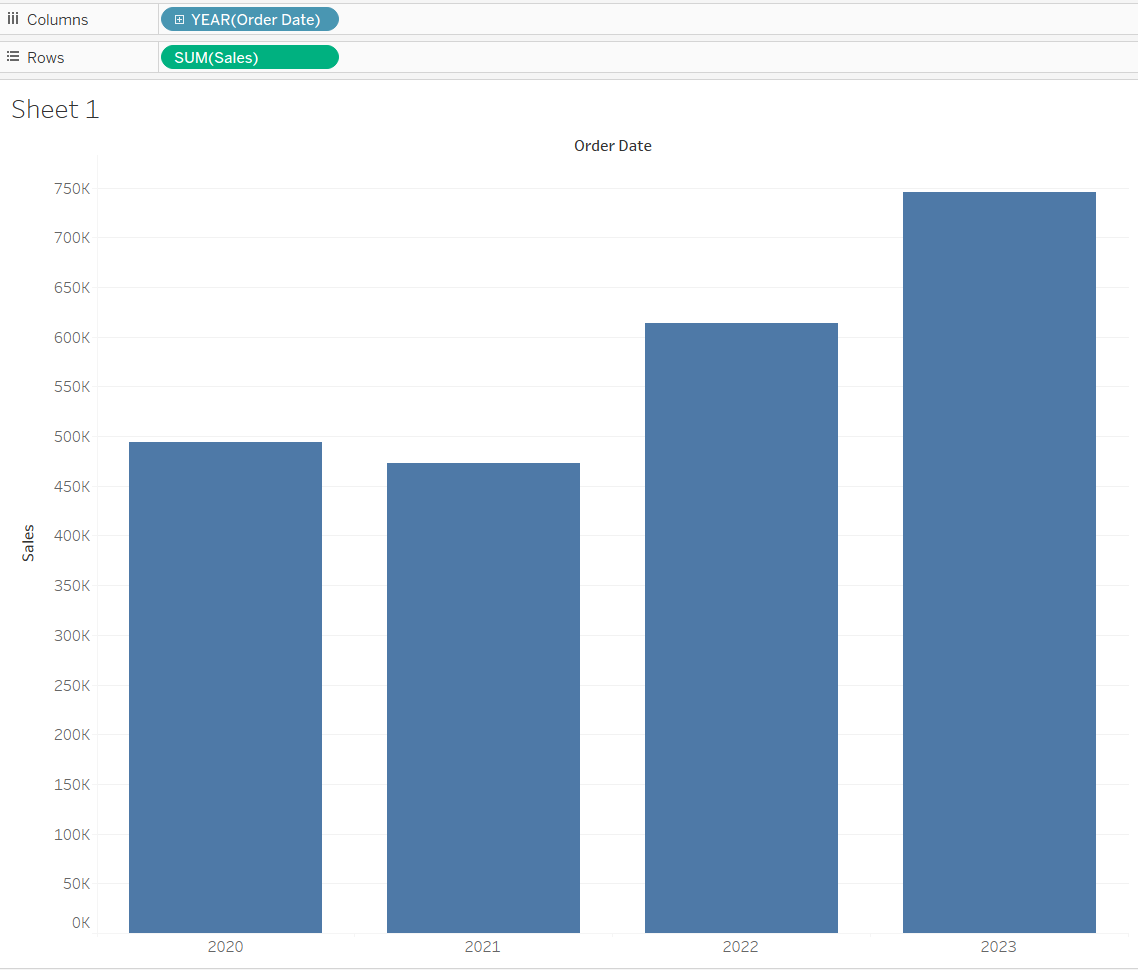
The two charts were built using the same variables. But, one is a bar chart while the other looks more like a histogram. What's the difference? The difference is in the way Tableau is interpreting the "Order Date" variable.
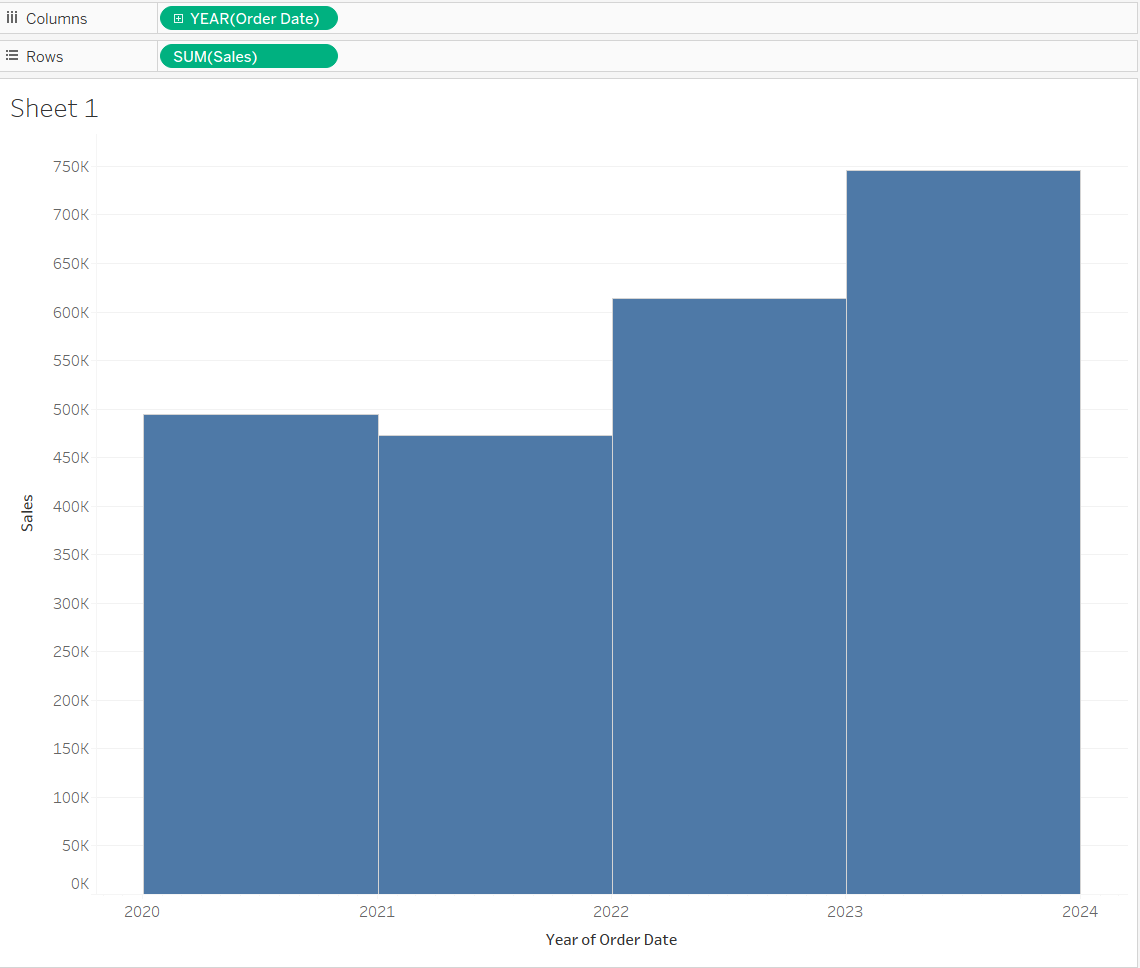
In the first chart, Tableau renders the "Order Date" variable as discrete values. In other words, the years in the column act as categorical headers. In the second chart, the "Order Date" field is rendered as a continuous variable. As a result, Tableau displays the sales data along a numerical axis. Hence, the chart looks like a histogram that's binning sales data between years.
You may have also caught on that continuous = green and discrete = blue.
Let's take another example. This time with measures and dimensions. Take a look at the two charts below. Can you tell what the differences are?
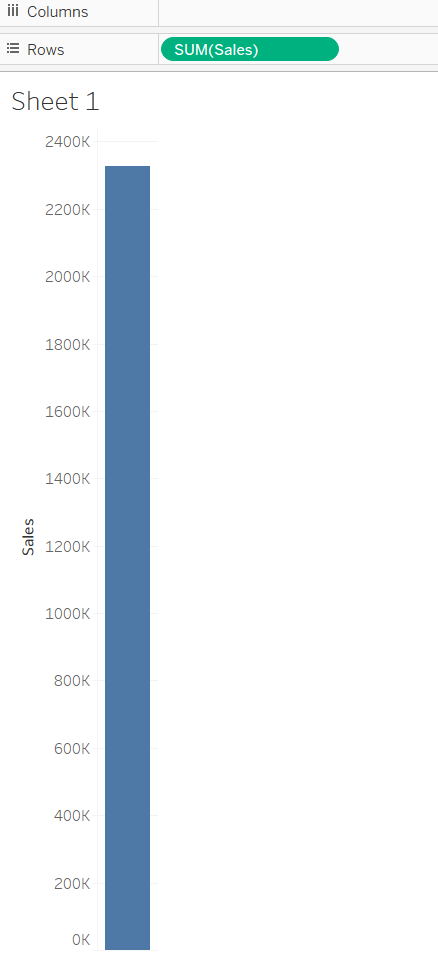
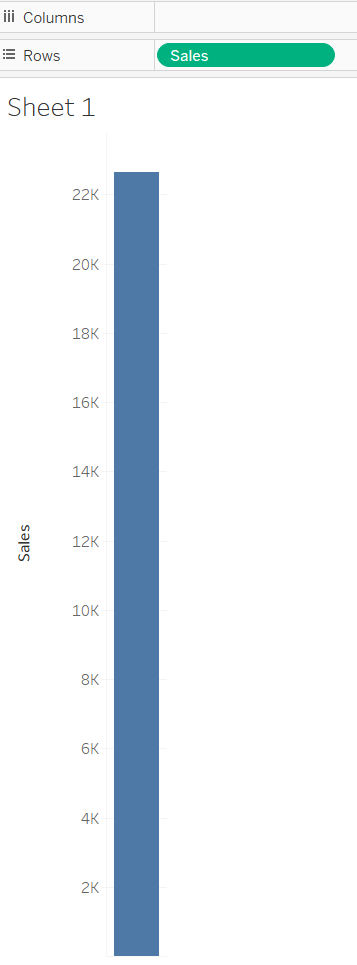
In the first chart, sales is a measure. Tableau automatically aggregates measures, and therefore, the bar chart is showing the aggregation of sales (sum in this case). In the second chart, sales is a dimension. If measures are aggregated, dimensions are dis-aggregated. If you've replicated these charts in Tableau, you'll notice that the second bar chart actually constitutes multiple data points, representing the sales of each transaction in the dataset.
This may seem like a lot, so here's a simple cheat sheet breaking down the differences between measures, dimensions, discrete, and continuous.
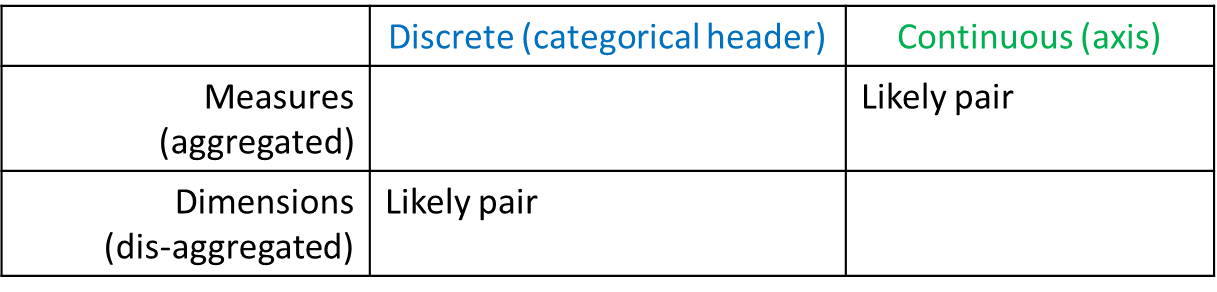
As you can see from the matrix above, discrete variables are more likely to be used as dimensions, while continuous variables will probably be used as measures. But, there may be cases when you'll want to have a discrete measure (an aggregated header) or a continuous dimension (a disaggregated quantitative variable).
I hope this helped you understand how Tableau handles measures and dimensions. And, how measures and dimensions can be both discrete or continuous. Make sure to practice with all four combinations in the matrix to see how Tableau handles different categories of variables!