


Scaffolding is a technique used to artificially create a data structure to aid in analysis and visualization. Depending on one’s needs, this could mean inserting rows into an existing dataset or creating an entirely new dataset to be joined with the original dataset.
This may seem abstract, so we’ll walk through an example in Tableau Prep of how scaffolding can enable data preparation and analysis. If you’d like to follow along, here’s the dataset I’ll be using.
The Hospital Bed Problem
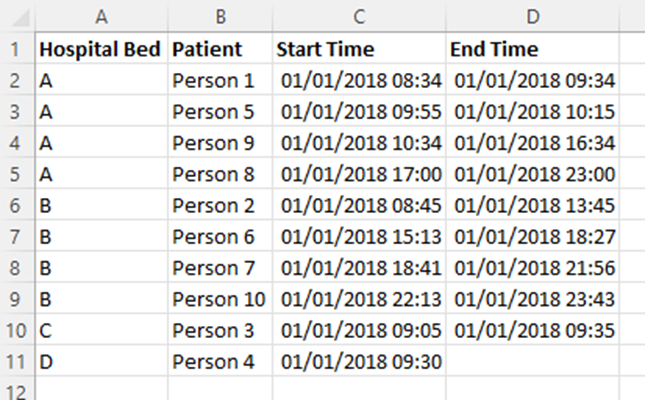
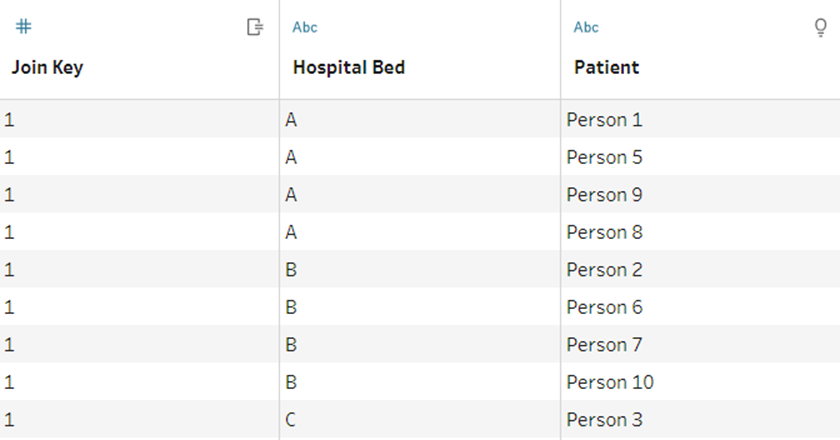
Let’s say we were given the below dataset showing at what time different patients were admitted into the hospital, which bed they were assigned to, and what time they were discharged.
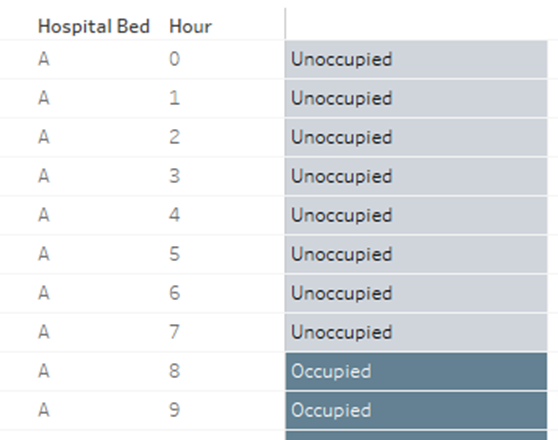
For the final output, we want to create a dataset showing during which hours of the day each bed was/wasn’t occupied in a 24-hour time period. The result should look something like this.
In the original dataset, each row of data shows each patient’s admission and discharge times, and the hospital bed they were assigned to. Because there are ten patients, there are ten rows of data.
In the final output, however, we want to show whether a hospital bed was occupied for each hour of a 24-hour period. Because there are four beds (A, B, C, D), we want 96 rows of data (4 x 24).
To solve this problem, we want to scaffold the original dataset to artificially insert more rows into the data.
Next, we’ll take a look at each step of the scaffolding process.
Scaffolding in Tableau Prep
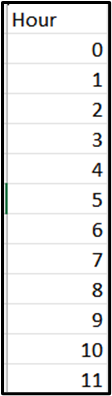
1. Create a new dataset containing hours
I created a separate csv containing hours from 0 – 23.
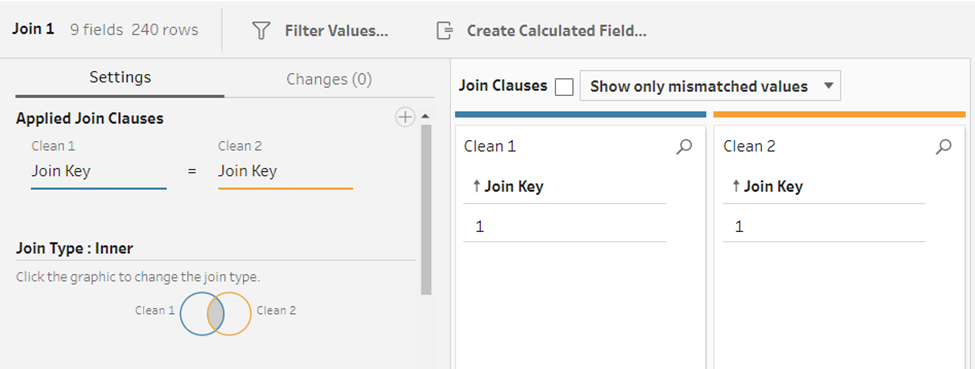
2. Import both datasets into Tableau Prep and join both tables using a join key
The next step is to join both tables. But you may notice that there are no shared fields between the two tables. This is where we’ll have to use a cross join, otherwise known as the cartesian join.
To do this, we’ll simply create a dummy “Join Key” field in each dataset.
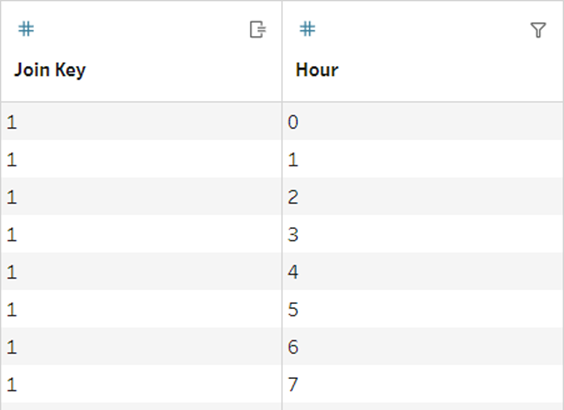
The result of the join should look something like this. You should have 240 rows of data. This is because 24 rows of data were added to each entry in the original dataset (10 x 24).
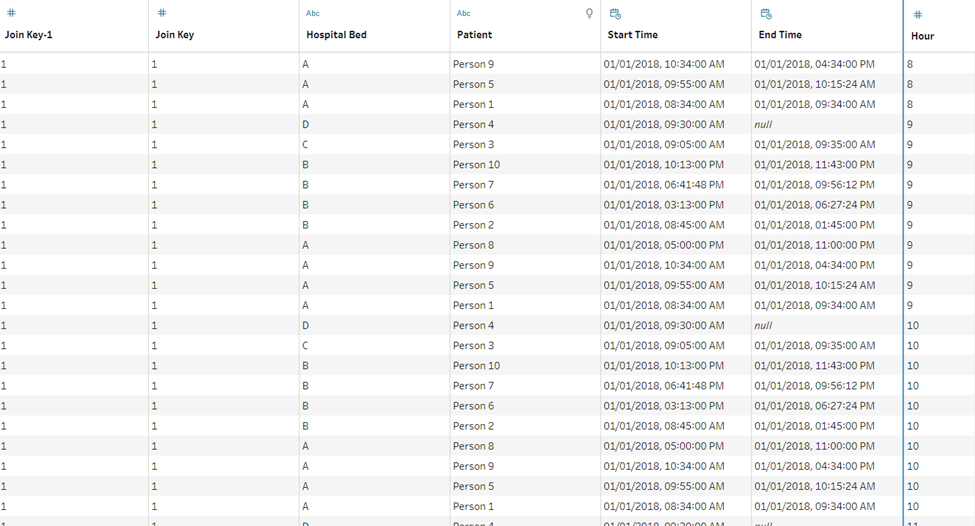
From here, we can perform aggregations and calculated fields to transform the scaffolded data into our desired output.
If you have Tableau Prep, give the scaffolding a try! Also make sure to see if you can shape the scaffolded dataset into the desired final output!