


Dashboard week day 3 consisted of using lyrics to make a dashboard.
Originally, the task was to use the Genius API to pull our own data on our favorite artists. However, we ran into some technical issues so we pivoted to a kaggle dataset: https://www.kaggle.com/datasets/deepshah16/song-lyrics-dataset.
I was disappointed that the kaggle dataset didn't contain my favorite band of all time - Dave Matthews Band. So I decided to just go with Coldplay.
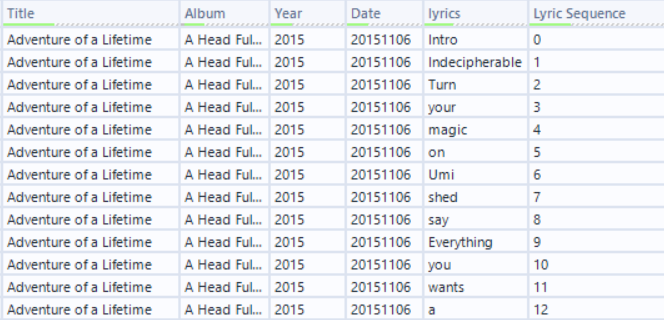
There were two files on Coldplay in the dataset. One was a csv containing information on Coldplay songs, including album, release date, and abridged lyrics. The second was a json file containing similar information but with full lyrics.
At first, I thought the csv contained the full lyrics. But upon preparing the data in Alteryx, I recognized that it actually contained a snip of the lyrics. So, I decided to bring in the json and join the json with the csv in Alteryx.
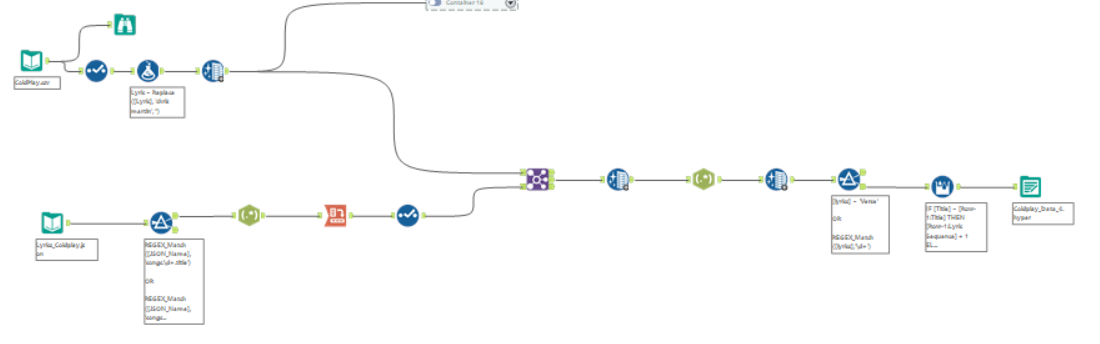
This is the final Alteryx workflow that I used to prepare the data. The main thing was to parse the words of the lyrics using regex, then assigning a sequential number to the lyrics in a song using multi-row formula. It will become clear why I did this when you see the dashboard.
With time running out, I didn't have time to really design a dashboard, so I decided to look at Tableau Public for some inspiration. I came across @vizraider's dashboard on Imagine Dragon lyrics: https://public.tableau.com/app/profile/redraider2k/viz/ImagineDragons/ImagineDragonsLyrics
I decided to pull some of the elements in his dashboard and implement them in mine. My final dashboard can be found here: https://public.tableau.com/app/profile/charles.yi/viz/DashboardWeek3_ColdplayLyrics/Dashboard1?publish=yes
To make sense of why I created the lyric sequence, I'll just show one graph from my dashboard.
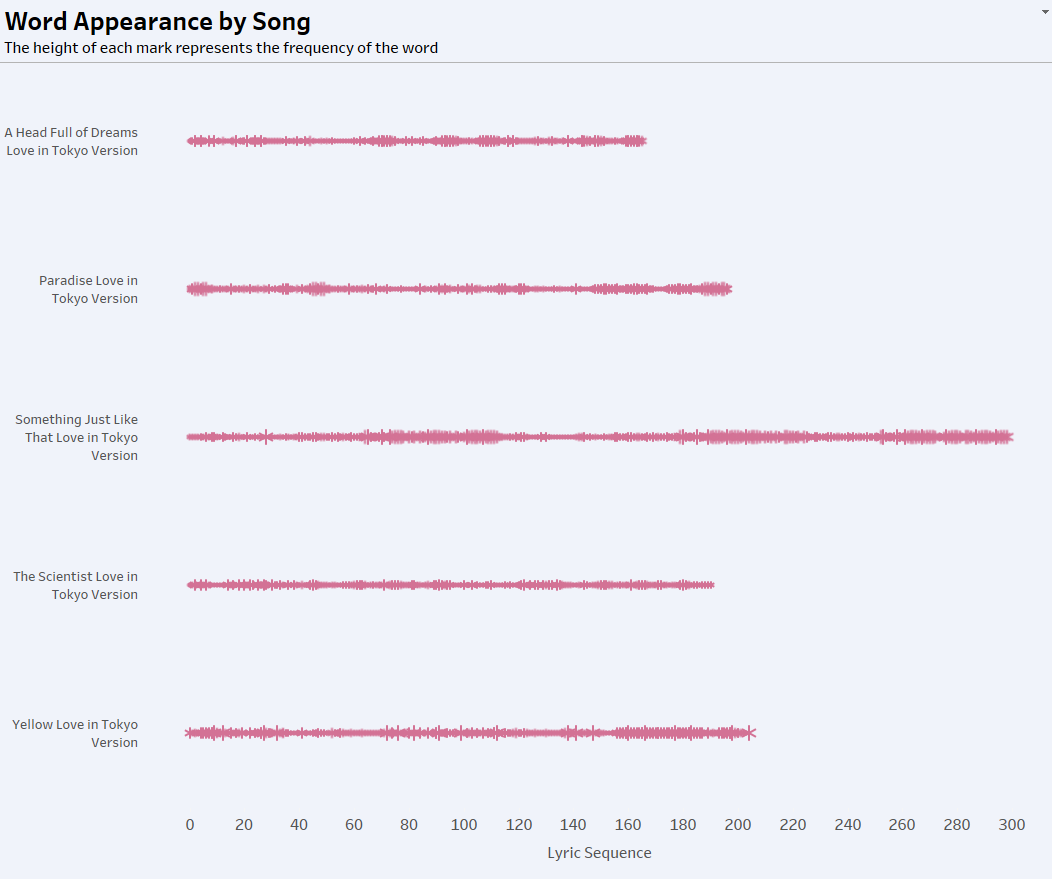
Each mark represents a lyric in the song. But to lay out the lyrics along a horizontal axis, I had to sequentially number each word in the order they were sung.
This was the conclusion of Dashboard Week Day 3. One more day left!