


The last day of dashboard week and training.
Today started off on a different note from yesterday, going from creativity no limits to requirements and a business dashboard. Today also posed its own challenges as I had financial data on balance sheets without a breakdown of all the assets and liabilities which made me think more deeply as this wasn't what I expected.
In the end I decided to take more of an overview which can be seen in the excalidraw below.
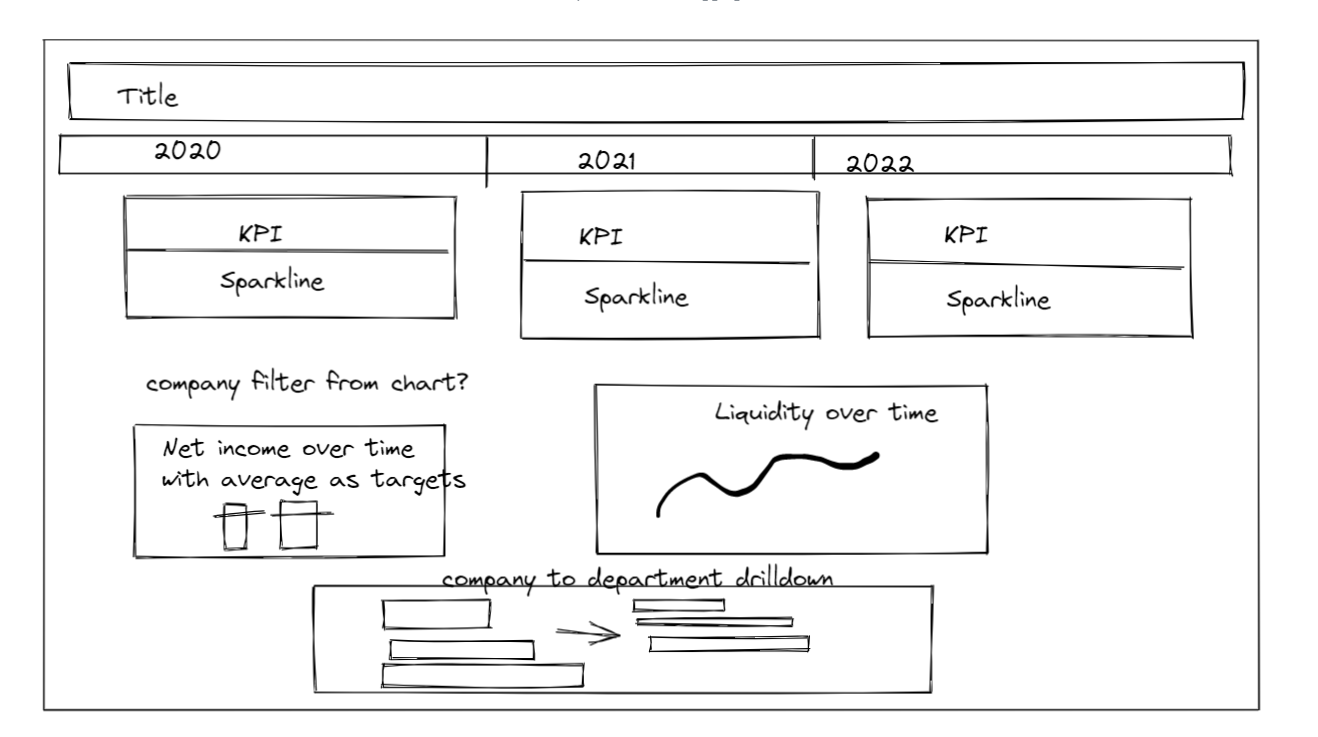
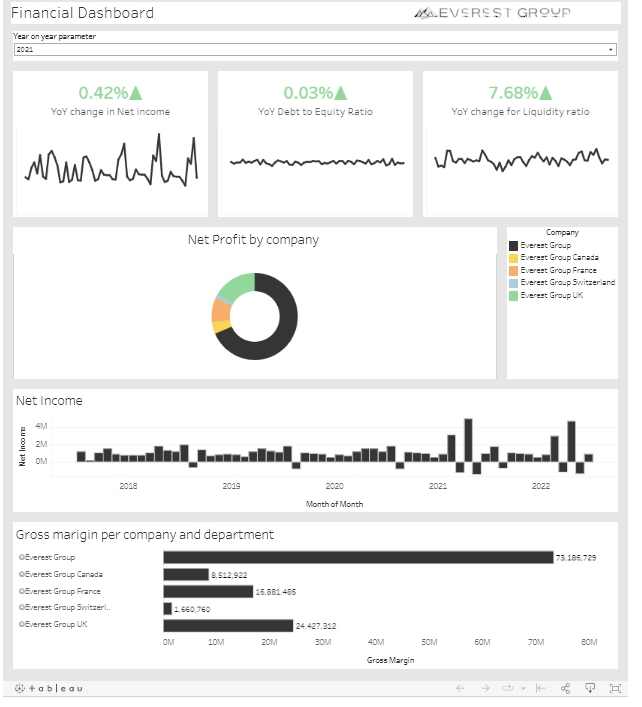
With my final dashboard ending up like the image above, I wanted to make the KPI's dynamic so when you select a different year it would change to the year on year change to the year selected. originally I wanted to have these as parameter action buttons but due to time constraints i left them as a parameter. I managed to get the KPI's to work by using a parameter and wrapping it within a year with the previous year calc using a date add to do the -1.
Then i decided to go for a pie chart to filter the branches on the net income chart. then finally i wanted to break down gross margin by company to company departments.
Overall training has been great.
The end of training, the start of bench.
To be continued....