


When prepping data for analysis, you'll often have to pivot rows to columns or columns to rows. This is a tricky concept to wrap your head around at first.
Performing a pivot in data prep software like Tableau Prep or Alteryx is straightforward, but understanding how to decide when to pivot data and what the expected result should be takes some thinking.
GUIDING PRINCIPLE: Each column should be its own field. You want all the information that's in the same category to be in the same column and you don't want too wide a variety of information in the same column.
Let's look at the two types of pivots: columns to rows and rows to columns.
COLUMNS TO ROWS:
You will come across this type of pivot frequently, as it's natural for us to organize data into a wide or cross-tabular format where we use the first row and column as headers and find data for Row 1 and Column 2 at their intersection.
Here's an example of a wide data table showing wake-up times for three different people through a week:
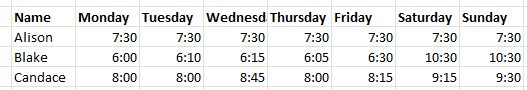
Although this is easy for a person to create, look at, and understand, it's not ideal for data analysis. Returning to our guiding principle, we see that we have many columns for "Day," each containing the same type of information, "Wake Time." We should pivot these to have one column for "Day" followed by another column for "Wake Time." The result will look like this:
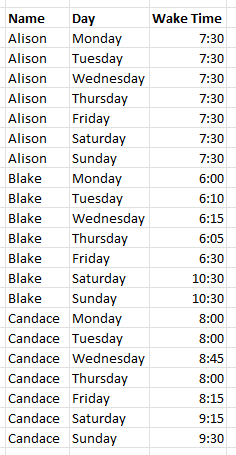
We end up with each row representing the wake time of one person on one day. Since there are 3 people and 7 days, we end up with 21 rows.
ROW TO COLUMNS:
Sometimes whoever makes the data table you're working with will have heard that data should be in long format and takes this too far, putting a bunch of types of info into one column.
For example, here's a table showing the "Pet," "Favorite Color," and "Age" of three different people:
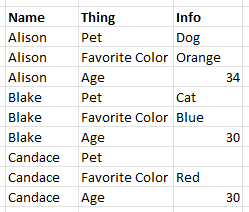
But "Pet," "Favorite Color," and "Age" are three very different fields. so we want to pivot them from rows to columns. Whenever we pivot in this direction, we will select two columns, one for keys (our future column names) and the other for values (which will become our entries). In this case, "Thing" contains our keys and "Info" has our values.
And here's the result of our pivot:
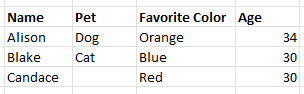
We end up with one row for each person with columns for each type of information about them.