


Today, we were tasked with building an informative dashboard using UNICEF data. We could choose any of the myriad datasets to work with. I set myself a time limit to make my decisions, aiming to have my data within an hour of beginning so I would have ample time to familiarize myself with the data and do any preparation that might be required.
The dataset on access to clean water caught my eye and I decided to build my dashboard around this. Since this dataset on its own gives a pretty flat view of things, simply showing stats about access to clean water for each country, I decided to flesh it out by bringing in data around illness and mortality. This would allow me to search for correlations and ask more interesting questions.
As I started exploring the relevant datasets, I noticed that the downloaded datasets were not the same as the tables I previewed using the "Query Data" tool on the UNICEF site, which gives you a nice user interface to query their data warehouse. I preferred the format from the data warehouse, and they offered the ability to add or remove fields in browser before downloading your custom dataset. One caveat: this ran quite slowly and sometimes froze my browser. However, you can download the full dataset without any customizations, so I decided to do this and then grab just my fields of interest in Alteryx.
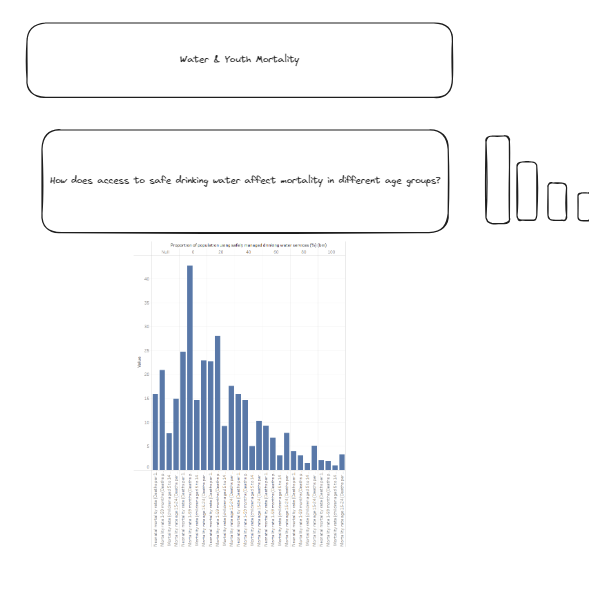
This ended up being way more work than I thought, and it eventually became clear that I had bitten off more than I could chew. So I gathered my patience and went back into the Query Data tool, limiting my number of fields. I scoped down to only look at drinking water quality and mortality rates in age groups from birth to age 24. With this new dataset, I quickly cleaned the data in Alteryx and output a Hyper File to move into Tableau.
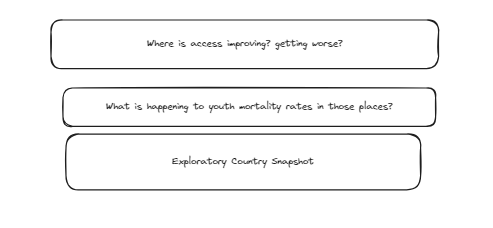
Low on time, I started making a few exploratory vizzes and a quick excalidraw.
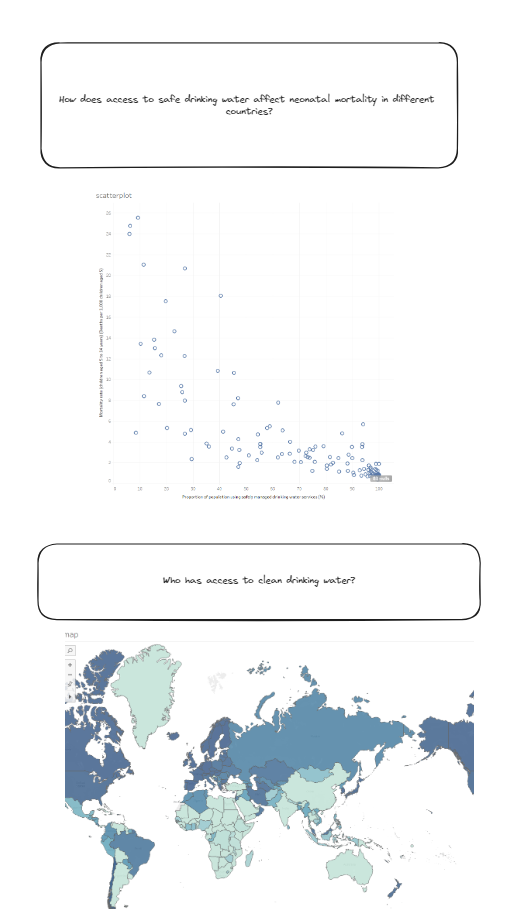
And then went to work fine-tuning my dashboard. Check out my Tableau Public for the "finished" product. I plan to return to this when I have time on bench to improve and expand it.