


There is a known issue in some versions of Tableau where when using calculated fields from an extract with dynamic zone visibility or dynamic axis titles, refresh extracts fail. If you come across that bug, you might want to swap charts without using dynamic zone visibility (DZV). Here's how to do it.
[another option is to use DZV without calculated fields]
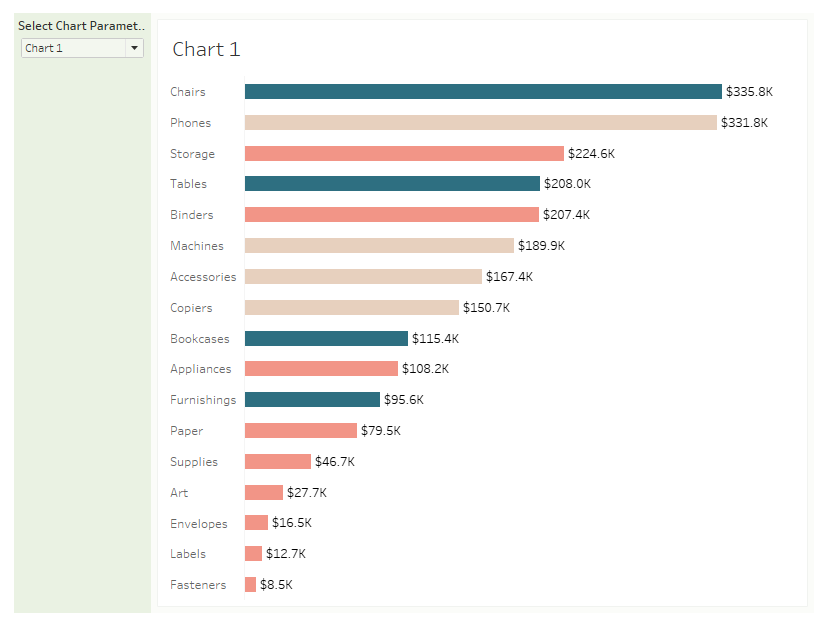
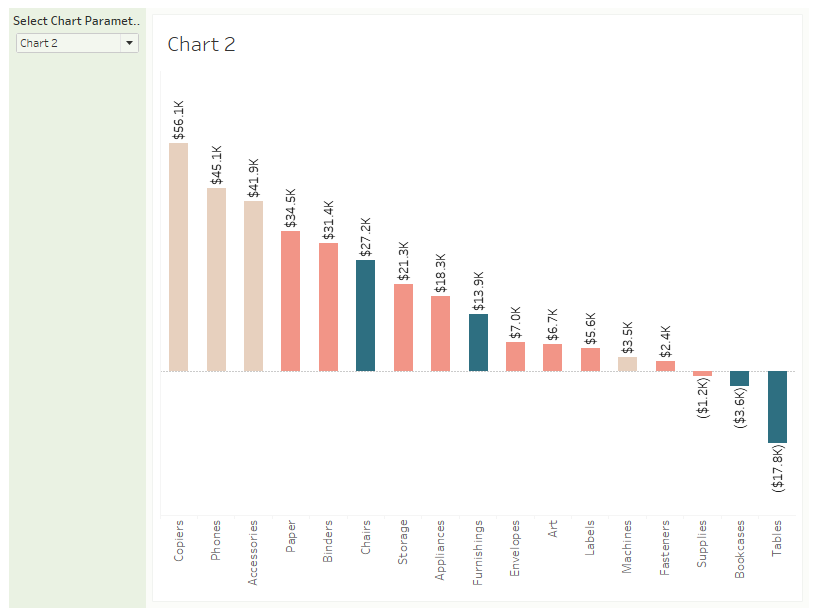
- Create the charts you want to switch between. Here we will have Chart 1 and Chart 2. You can easily adapt this method to use more than two charts if desired.
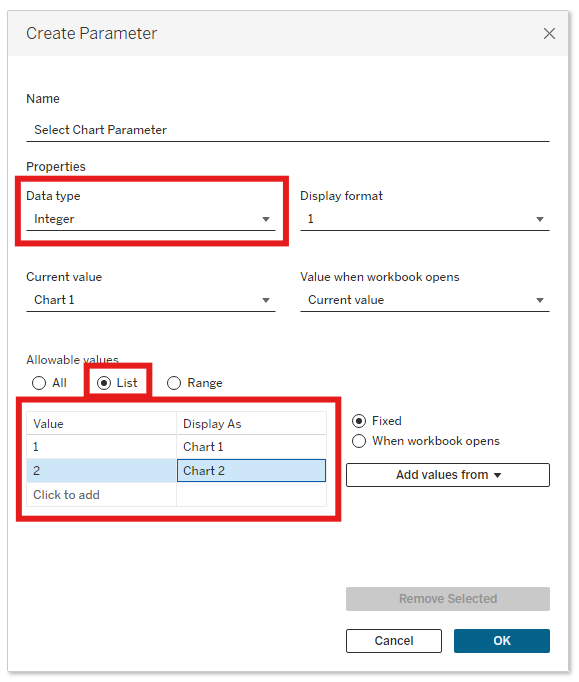
- Create an integer parameter that contains a list of integers as the values and the names of the charts you want to swap between as the aliases ("Display As"). Here, we will call our parameter Select Chart Parameter.
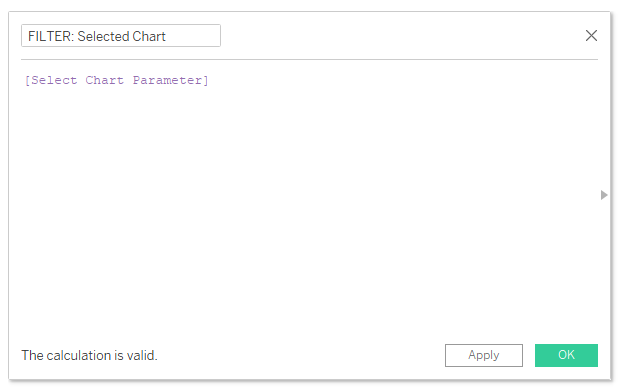
- Create a calculated that holds the value of your parameter. Here, we will call this FILTER: Selected Chart. This is necessary because we will be using filters instead of DZV and you can't use a parameter directly as a filter.
- On the sheet for Chart 1, make sure the parameter is set to "Chart 1"--right click the parameter and select show parameter so you can check and change it. Then drag FILTER: Selected Chart onto the Filters card. The only choice you will see is 1. Check this box. When you change the parameter, you should see the chart disappear.
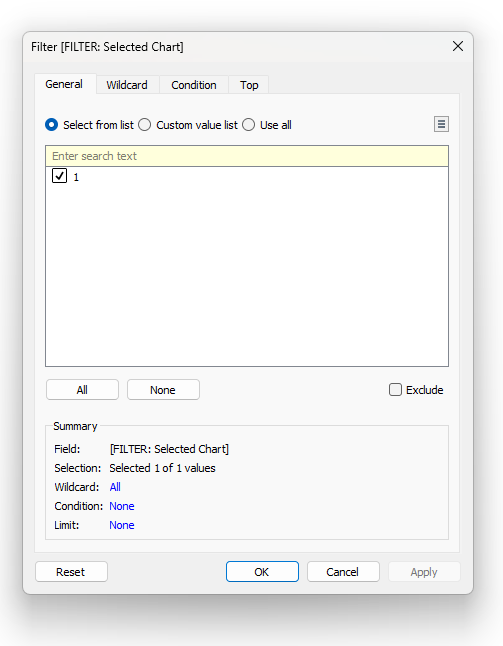
- Go to the sheet for Chart 2, show the parameter, and switch the parameter to "Chart 2." Again, drag the calculated field onto Filters, but this time check the box for 2.
What we've done is filtered out all values on one chart when the parameter is set to the other chart. So when we switch the parameter, one chart or the other will become blank.
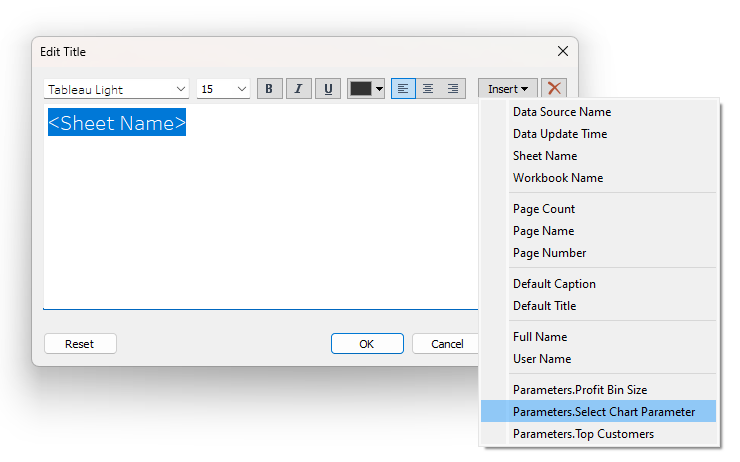
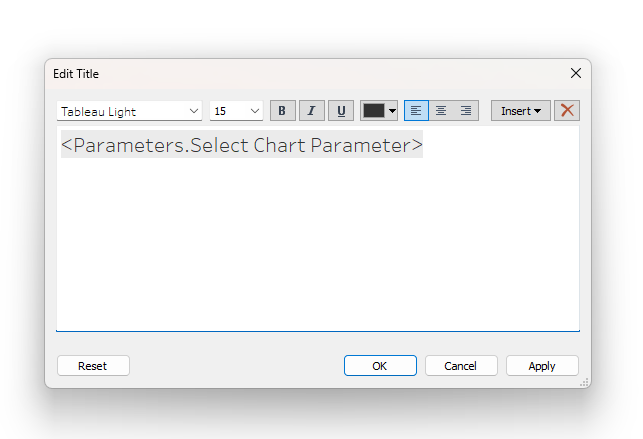
- Create a sheet for the title: Create a new sheet and edit its title, replacing <Sheet Name> by inserting Select Chart Parameter. We will need this because we need to hide the titles on the sheets for this method to work properly, but we want the title to dynamically change when the sheets change.
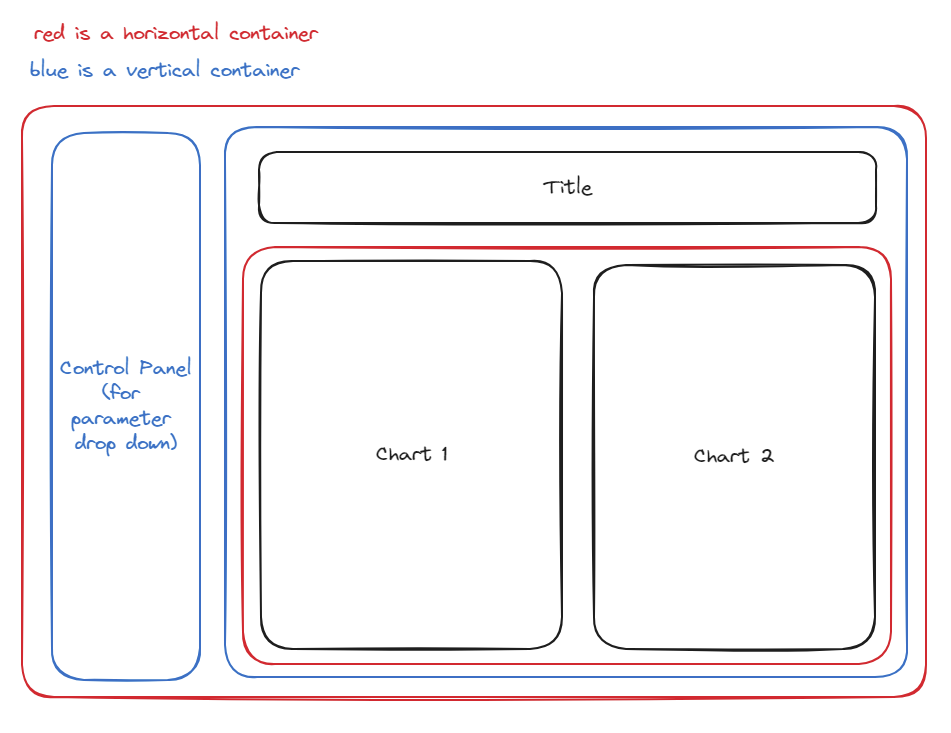
- Add the title, both charts, and the parameter drop down to a dashboard, following the suggested container structure below:
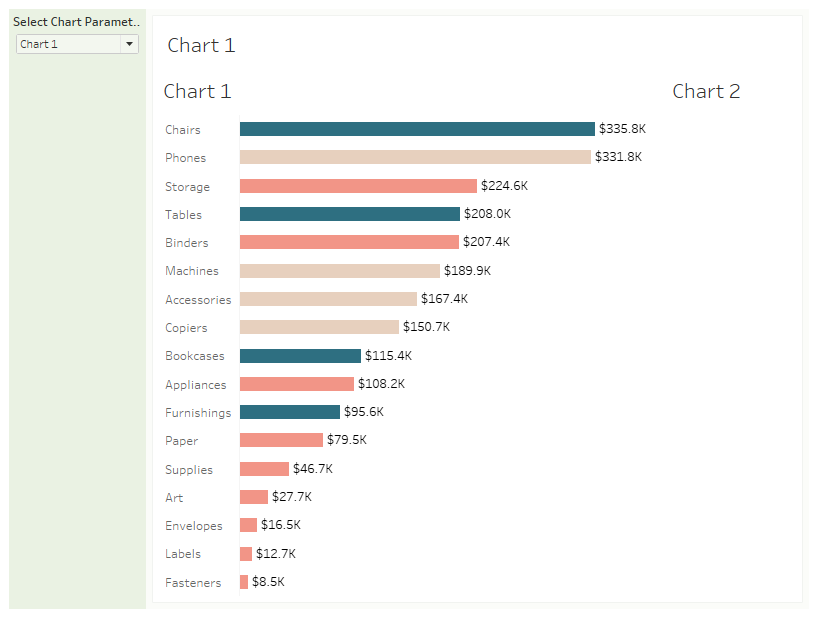
Right now, only one chart is populated, but the other chart still takes up space. This is because even though all the data is filtered out, the chart title is still taking up space.
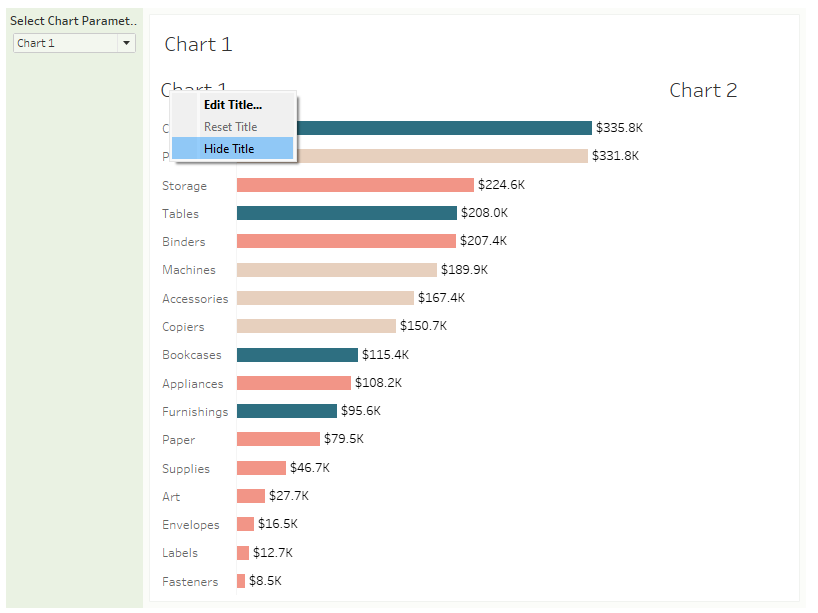
- Hide the chart titles on both charts by right clicking each title and selecting "Hide Title."
Now only one chart shows at a time and it expands to fill the whole space.
Voila! You've created a chart swap without using DZV.
Check out and download my dashboard that uses this technique to swap between three charts.