


A couple months ago, I attended an Alteryx Cloud Training provided by Alteryx to Data School consultants, which covered several of their cloud products including the exciting Alteryx Auto Insights. The information I'm sharing here is based on that training--tools are always being updated and improved, so some information may no longer be accurate.
Alteryx Auto Insights (AAI) is Alteryx' artificial intelligence product that can automatically create KPIs, reports, and presentations from datasets with a few prompts for the user.

How do you use it?
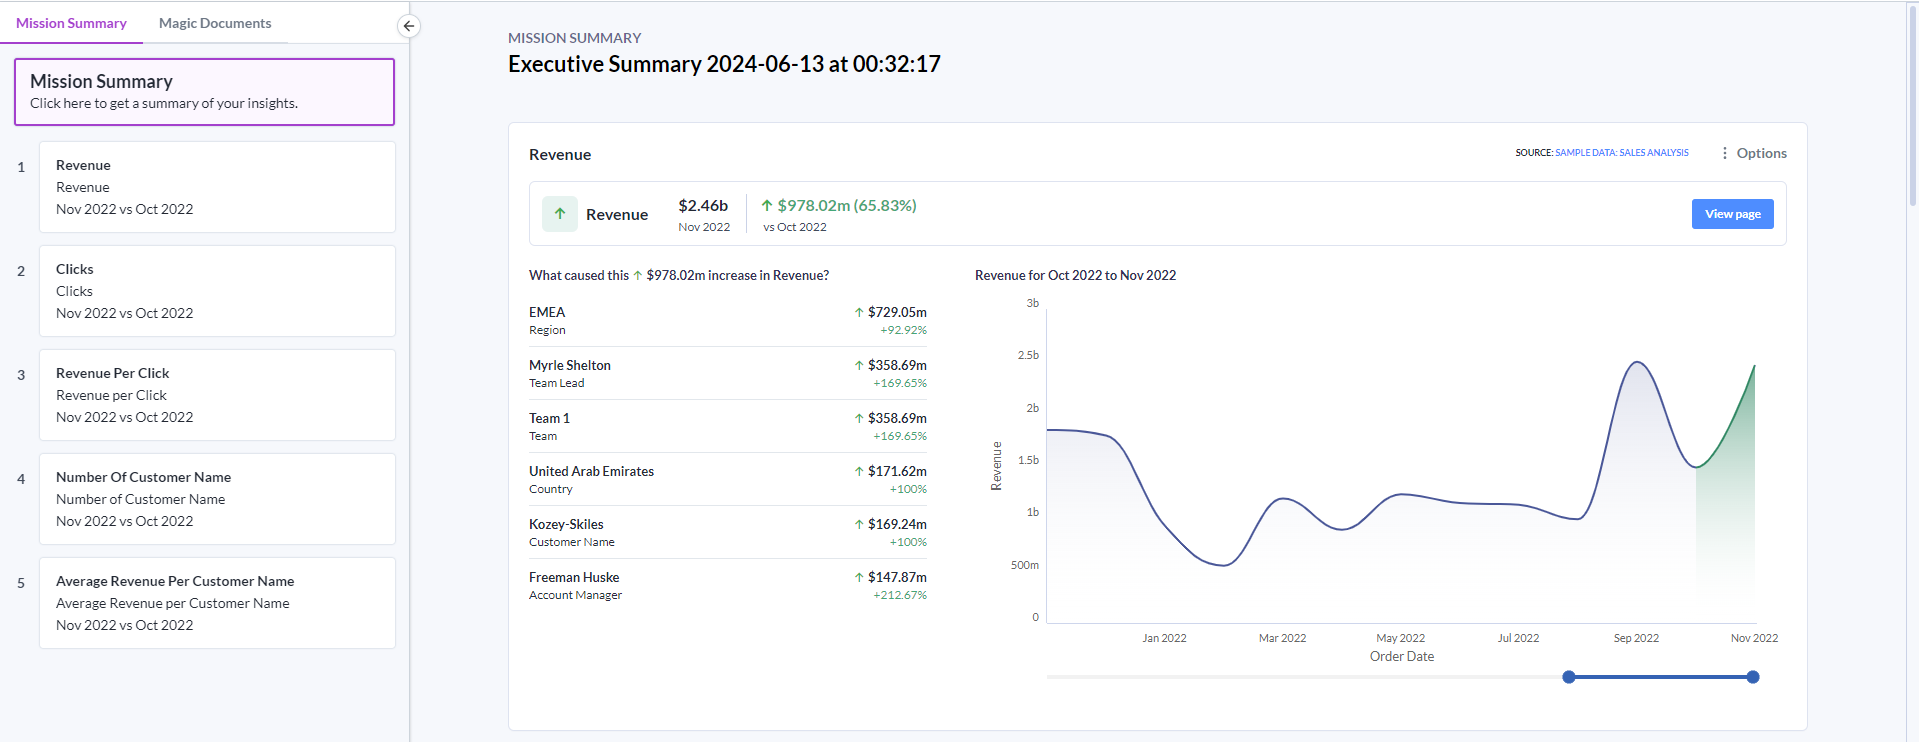
You define a "Mission" by choosing a use case--Executive Summary, KPI Deep Dive, Correlations Analysis, or Playbook (report) and selecting datasets and measures to use.

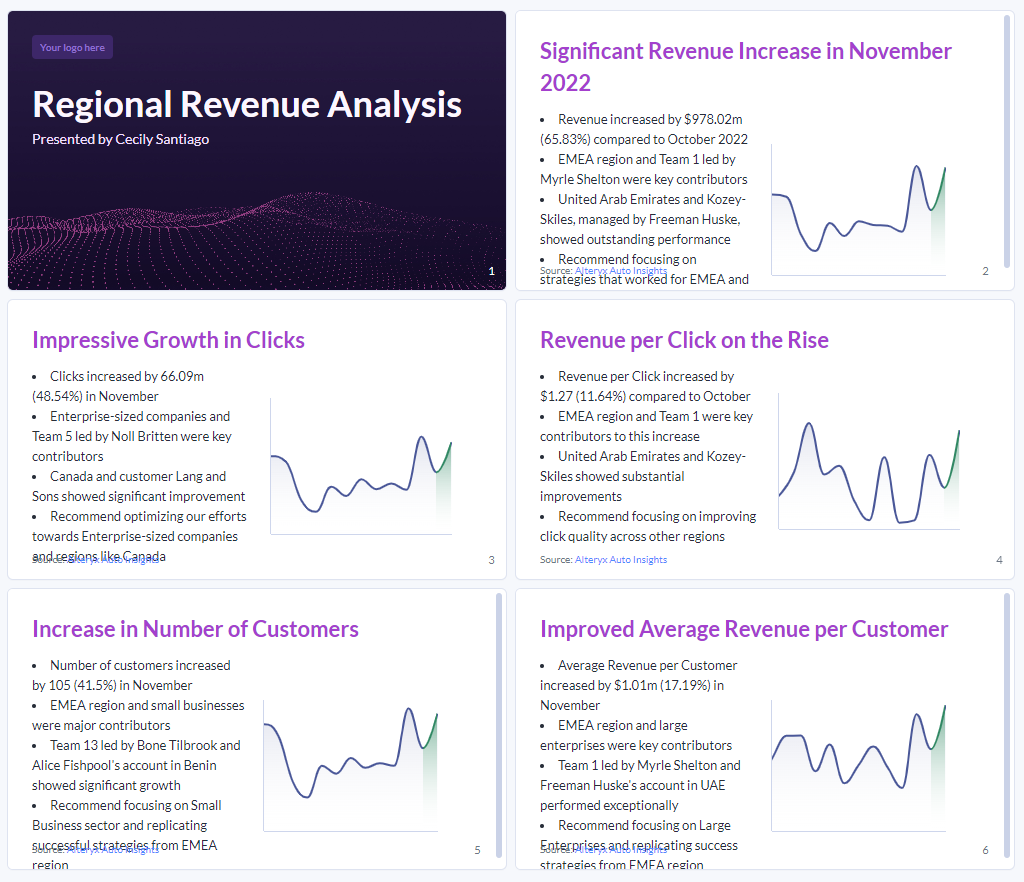
It then generates pages with charts, KPIs, key drivers, and some analysis written in natural language. You can filter and tweak these pages and choose what to show or hide on each page and what pages to include or delete.
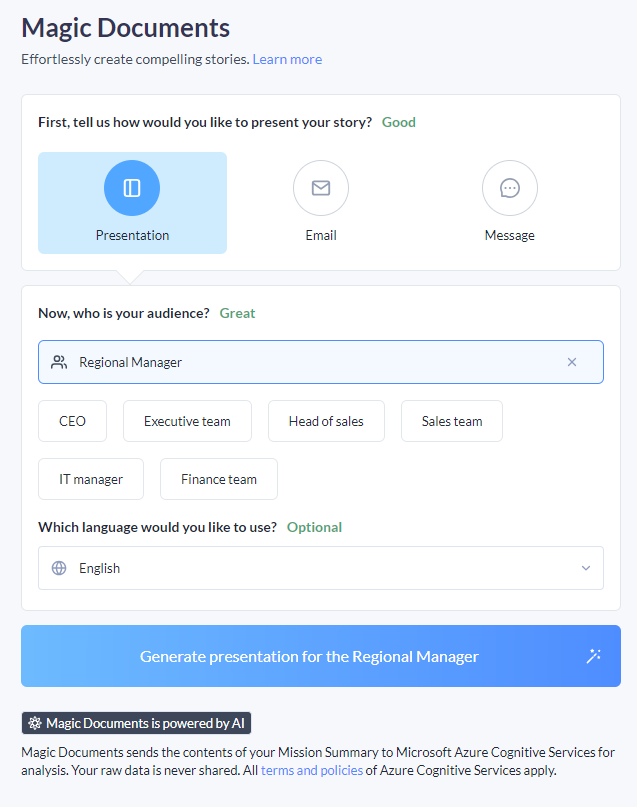
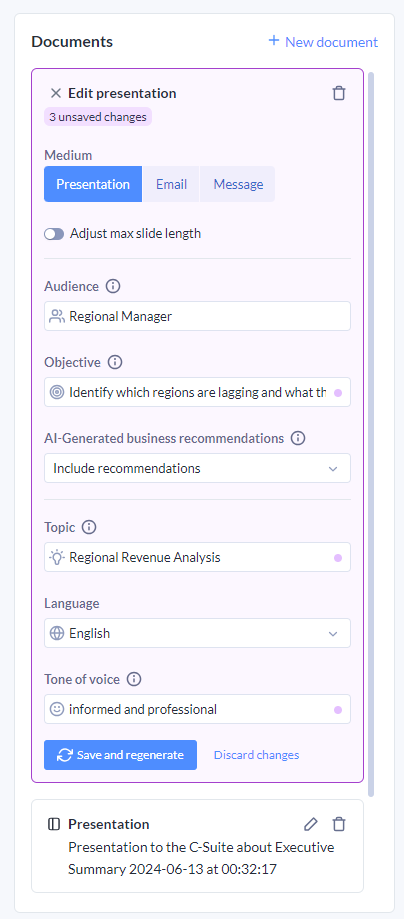
Once you're happy with the pages, you can use the "Magic Documents" feature to create presentations, emails, or messages. Here, you can specify things like audience, tone of voice, purpose, etc. using natural language.
Use Cases
AAI is best used for basic, repetitive, frequent reports. It can analyze trends and root causes easily, automatically checking for contributing factors in all measures. It can create basic chart types like bars, lines, and scatter.
It doesn't offer forecasts, it isn't adept at infrequent reporting, and it doesn't do well with highly aggregated data or data more granular than daily.
Data Requirements
Like other AI data analysis tools, AAI requires data to adhere to certain structural requirements. If you're collecting data with the intention of using AAI, you should keep the following requirements in mind:
- No free text or unstructured data
- Column names in first row, can't start with numbers or special characters
- At least one measure as some numeric data type
- At least one categorical field, ideally at least 5, ideally at least two distinct values in each field
- No larger than 10 GB, ideally around 2 GB
- Ideally has a date field, ideally goes back at least 7 months
- Ideally daily data--cannot handle finer granularity
- Feature engineering such as binning data, changing names of values, etc. needs to be done in data preparation before loading data into AAI
My Reflection
AAI impressed and excited me! I found it to be more robust than other tools I've tried. I could see technology like this significantly changing the job of data/BI analysts, shifting focus away from building and analyzing visualizations and instead necessitating more work on gathering and preparing data to meet AI requirements and ensuring AI analysis is accurate and relevant.
That said, it's not (yet) at a point to replace data analysts.
The reports it generates are pretty generic. They are probably useful for almost any business, but they will probably not meet all the needs of every business. And time must be spent cleaning and preparing data for input into AAI.
Additionally, AAI doesn't currently have the ability to identify which elements of the report are significant. When it generates the mission, it shows charts and allows drill-downs relating to everything that might be relevant, so you need to spend time manually curating which charts to include in the final report. Someone without data analytics experience could easily get overwhelmed with this task, so a data analyst is still necessary here.
This is still really new, so I expect it to overcome some of its limitations in the coming years and gain new abilities.
For now, it can be used to save time doing preliminary data exploration or quickly producing attractive and clear reports for basic use cases. Of course these will still need review before sending them off to stakeholders, but this will take much less time than building them from scratch time and time again, freeing us up to do more interesting bespoke analysis. Eventually, tools like this might speed up that too.