One of the first things we notice in tableau when handling our imported data is that they are colour coded blue and green. If you mess up then you'll encounter the colour red, letting you know something wrong.
The green and blue, however, what are they?!?
The answer. Blue data is discrete data and green data is continuous.
Great. What the heck does that mean?
In essence, it describes the scalability of the data.
- Discrete data is not scalable and is qualitative data with finite domains. They are normally data that form headers in your charts such as name, item sold etc. These cannot range and are fixed to a certain value. ie, john smith cannot range to anything else, it is a fixed name.
- Continuous data on the other hand is quantitative, scalable and has infinite domains. They are normally the data that you form your axis from in charts such as sales, profit etc. Though unlikely, the amount could be infinite.
THE RULE BREAKER. DATES!!
Dates are mischievous, they can be both discrete and continuous.
Let us use an example to visualise this.
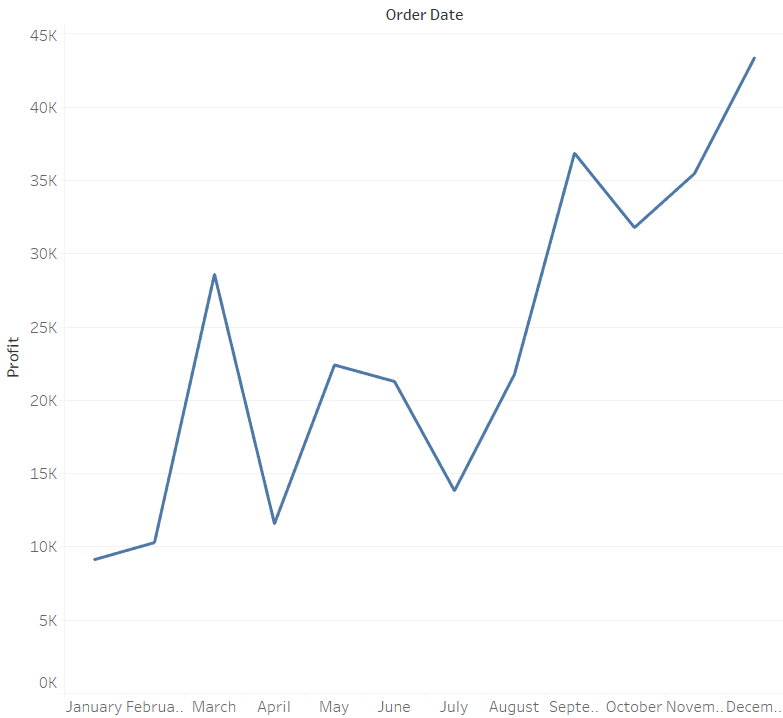
We have data on profits between November 2017 to November 2021, lets set date "month" to discrete and have a look:

When we set date "month" as discrete and look at the profit we see the profits those months made. But wait; what year is this for? 2017, 2018, 2019, 2020? What is it showing? ALL OF THEM. As the date is discrete, this chart is showing us the TOTAL profit that one month produced throughout those 4 years. This is because "january" is set as discrete and therefore cannot be broken down into jan '17, jan '18, jan '19 etc. If it did then it would be continuous as the year can be infinite. This way it has aggregated the profit of all the years onto a single data point
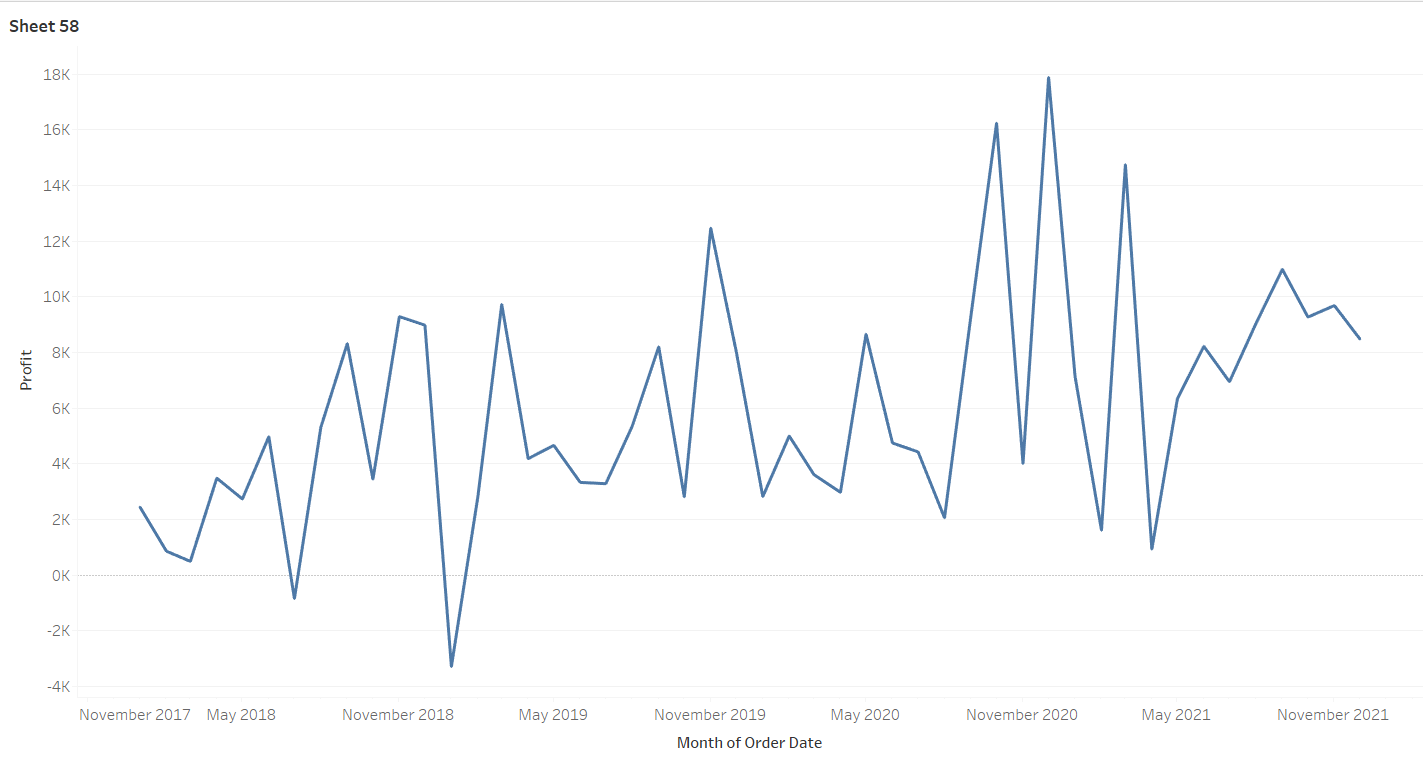
Now let's look at the graph if we switch the date to continuous:

Unlike the previous example, our graph now shows the profit for each month in each of the years. It has broken down the 2017-2021 period into individual months for each year. This data is now continuous as theoretically our date could reach infinity and keep going. Finally, if we wanted to construct the discrete graph using this one we can see that the January in our discrete graph is equal to the sum of jan '18, jan '19, jan '20, jan '21 in our continuous date graph.
Hopefully, now you have grasped a knowledge into the meaning behind the green and blue pills and can see how versatile and useful dates can be for us.
