


Last day of dashboard week! With just a few hours on the clock, we were tasked to design a dashboard using a World Cup Matches dataset.
When I think of the World Cup, the country that immediately comes to mind is France. Therefore, for my dashboard I wanted to explore what has contributed to France’s victory in the Men’s tournament. The main question I had was has France always been a dominant team, or has this been a more recent trend?
Today’s Limitations: The blockers today were the calculations. Due to the structure of the data, where each row was a single match, a lot of the calculations consisted of fixed statements and nested if then’s.
This was my final dashboard:
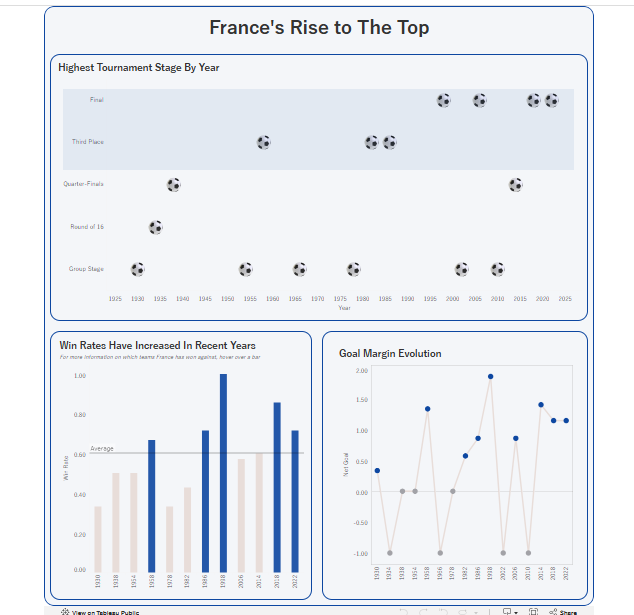
France’s Men's team has seen a recent surge in tournament finishes, win rates and net goals. Moving forward, I would like to expand on this research and explore what has fueled this turn of events.