


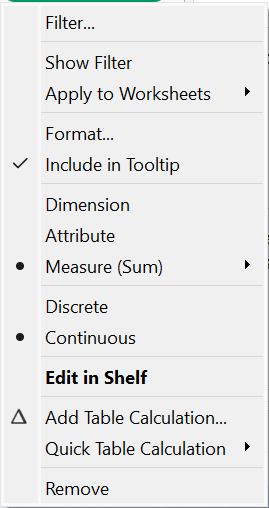
You can calculate a variety of of things in tableau via table calculations. If you right click on a measure, the drop down menu will show a list of options including 'Add Table Calculation' and 'Quick Table Calculation'
The Quick Table calculation will give you a list of options for calculations you can do quickly with the data on your table - in the example below there was no DateTime data so the time calculations have been greyed out as they would not be possible.
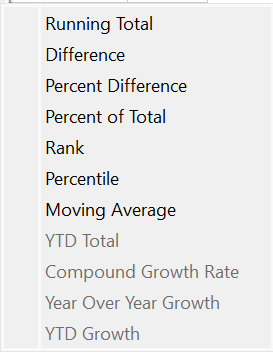
It is never really advisable to use this tab unless you only have one measure and one dimension. Otherwise, it is worth using the 'Add Table Calculation' option. This is because it will find the calculation of the entire data set which may not be the most useful.
The 'Add Table Calculation' pane will give you the list of possible calculations you could do with your data type - so this bit is essentially the same as the quick table calculation function.
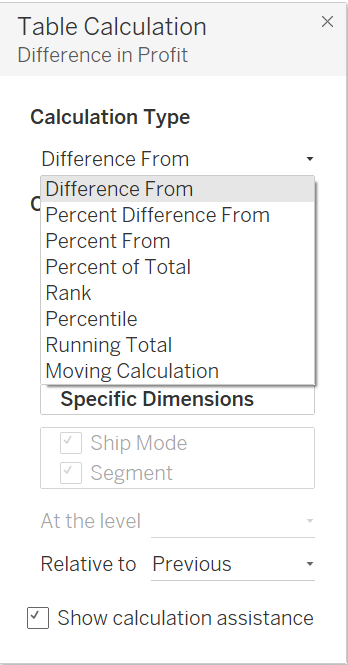
The thing that adds detail (and complexity) to your calculations is the compute using options
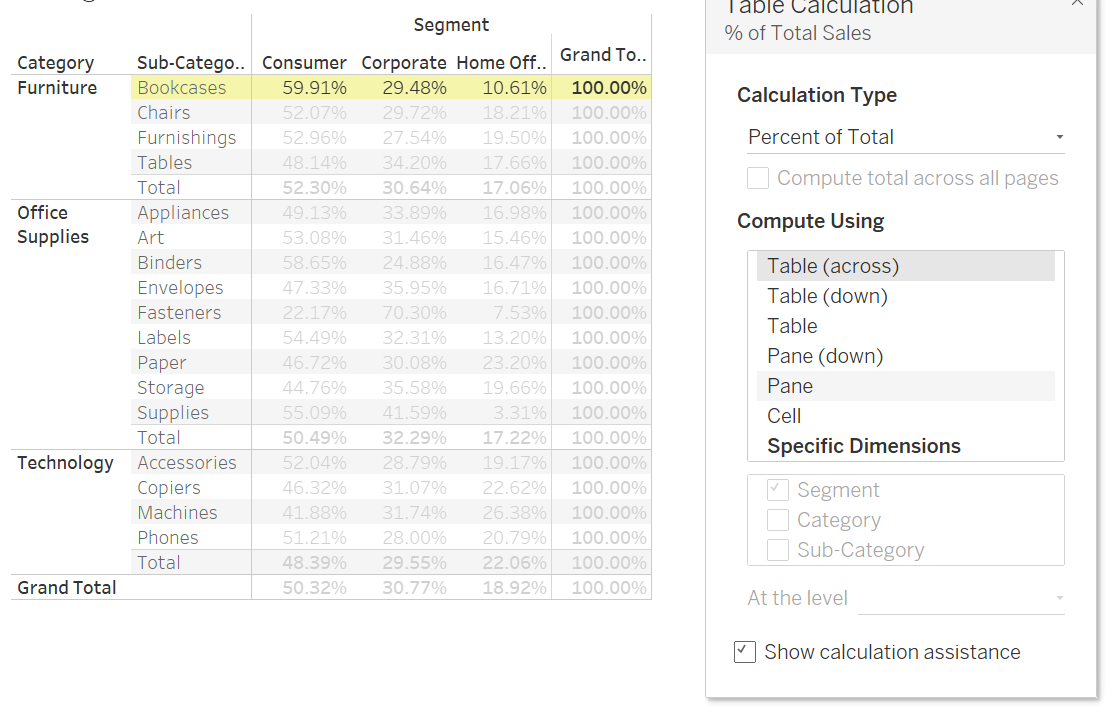
If you use table (across) the calculation will be based of of the single rows of data and the calculation will re-start in the next line.
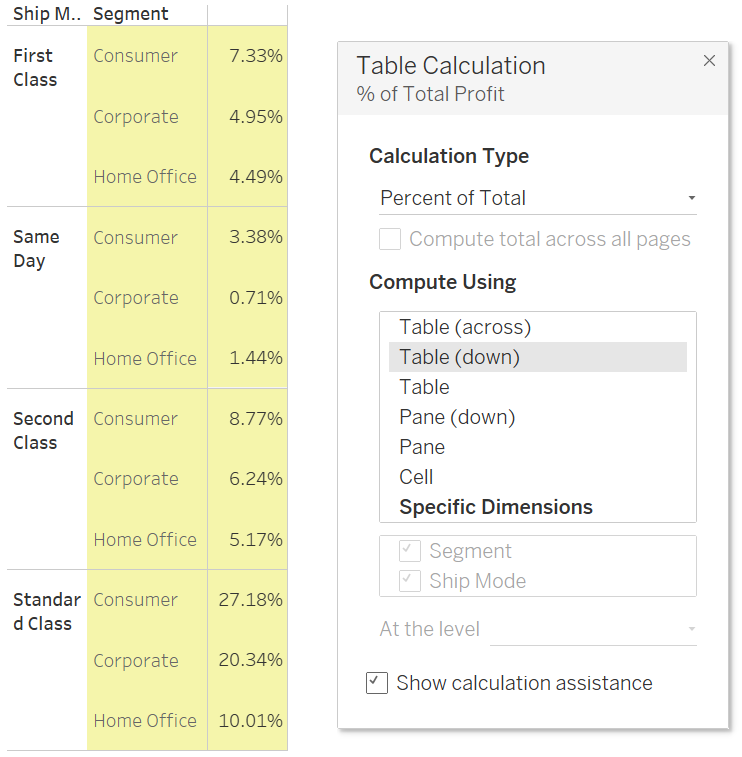
Table (down) will show you a calculation based on the a column, if you had multiple rows of data, the calculation would restart when you move onto the next row.
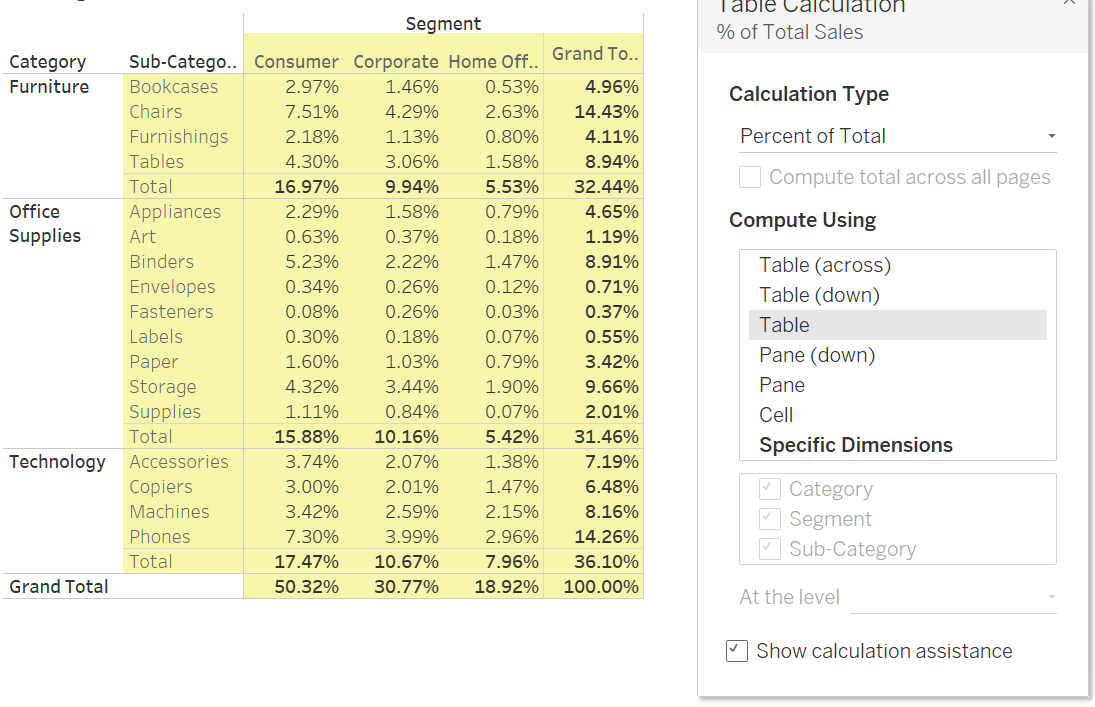
Table will give you the calculation of each part of the data based on every part of the data that is in your table (so in this case the percentage of the grand total).
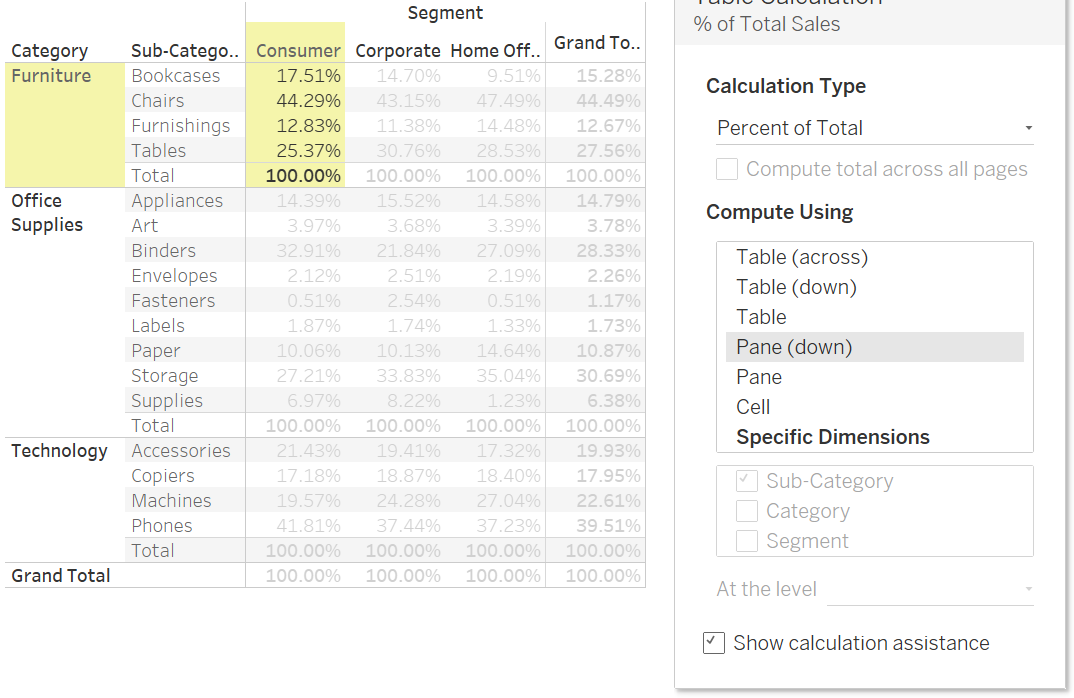
Pane (down) will give you the calculation based on the first break down of your data. So in this case it will calculate based on category for each segment.
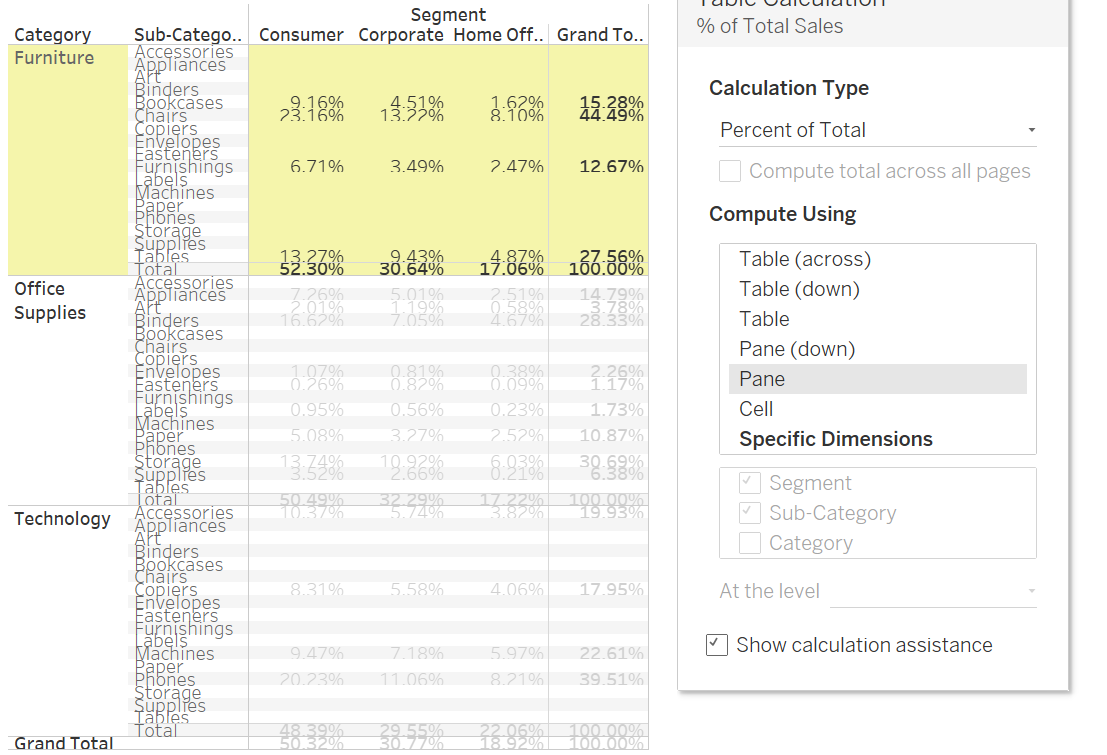
If you were to calculate from the pane, it will give you a calculation based on the first row of your data. So this example will give you calculations based on all of the furniture category.
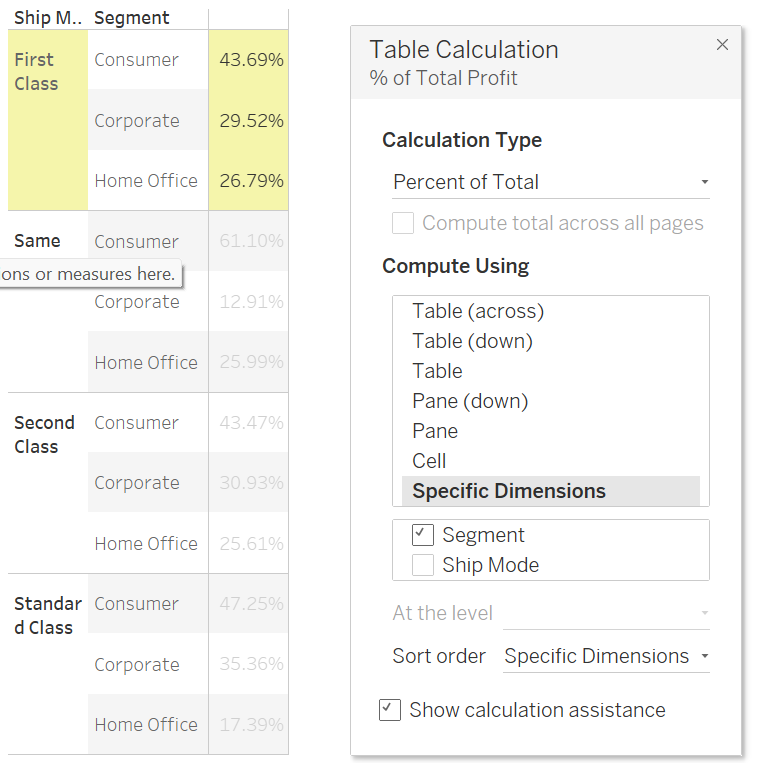
The most useful way to compute your data, is the specific dimensions tab. This means that you can do table calculations by selecting the thing that you want to compute via. This means that if the segment is selected, a new calculation occurs for every different type of ship mode, and the totals (so 100% of the calculation) would be calculated from the total from the three segments.
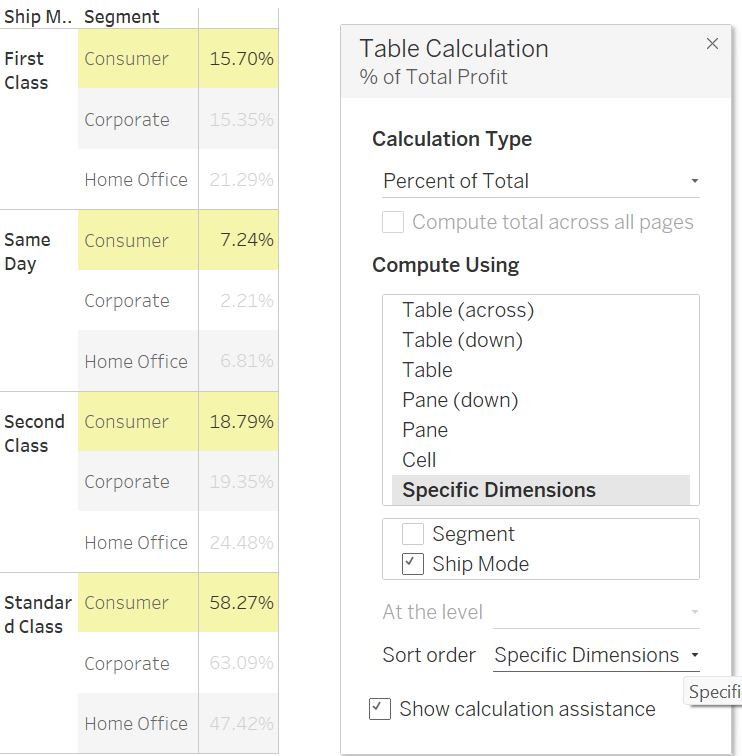
Similarly, if you calculate by specific dimensions and select ship mode, for each part of a segment, 100% is found between the four different ship modes.
The main reason that specific dimensions is the best idea to use is that it is dynamic. If you select to calculate based on a specific measure it will stay this way even if you change the appearance (and order of data) on your graph. Whereas if you compute using other methods, it will give you calculations based on wherever certain fields are - meaning you may lose sense in your data (or even accuracy).