


Today was day three of dashboard week and here is what we got up to...

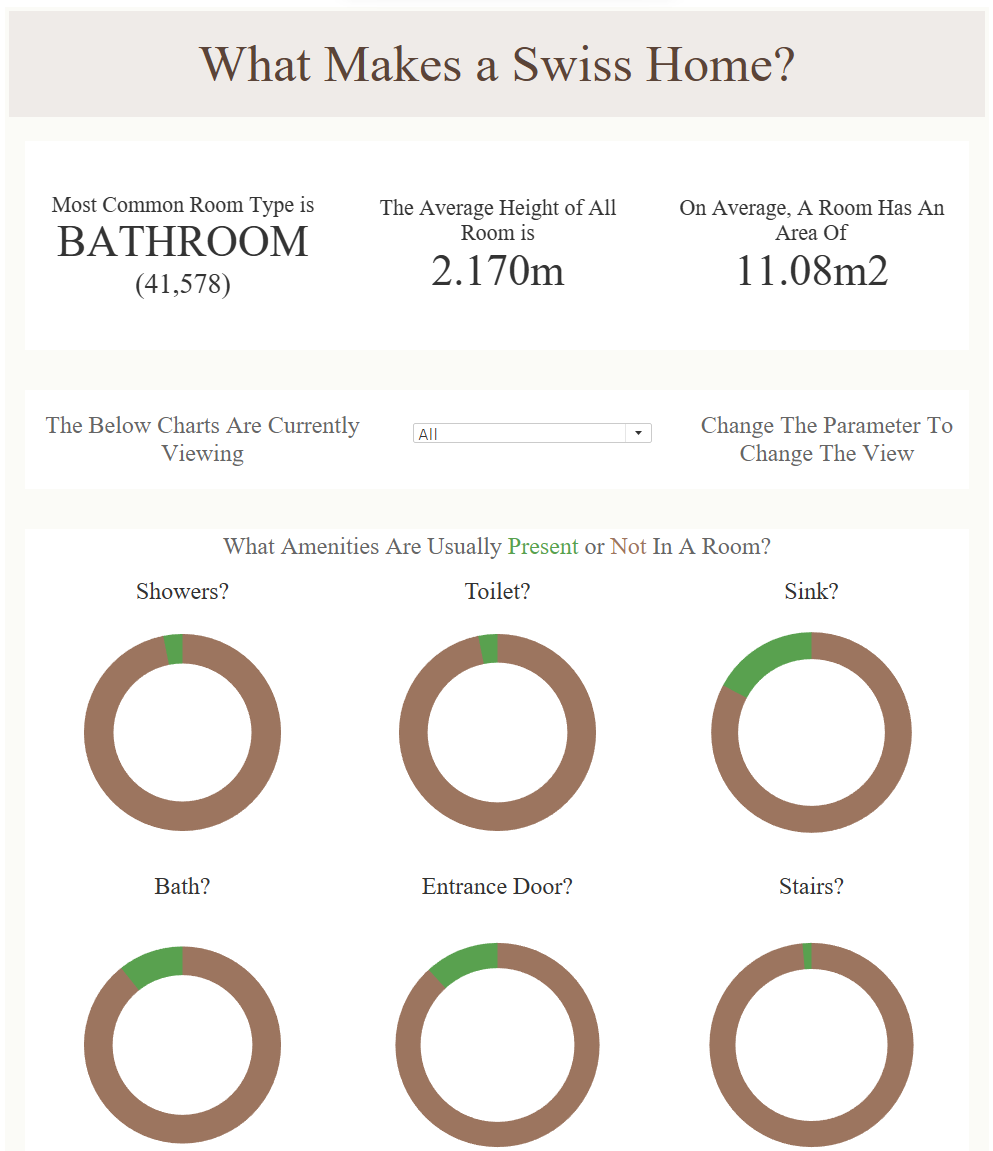
After looking at the data I decided the path I wanted to take was to look at the factors that made each room in a swiss house.
I started in alteryx but filtering out the data so it only contained residential buildings, and areas within a house (instead of walls for example). I joined this to the simulation data and removed any columns I didn't believe were necessary for my output.
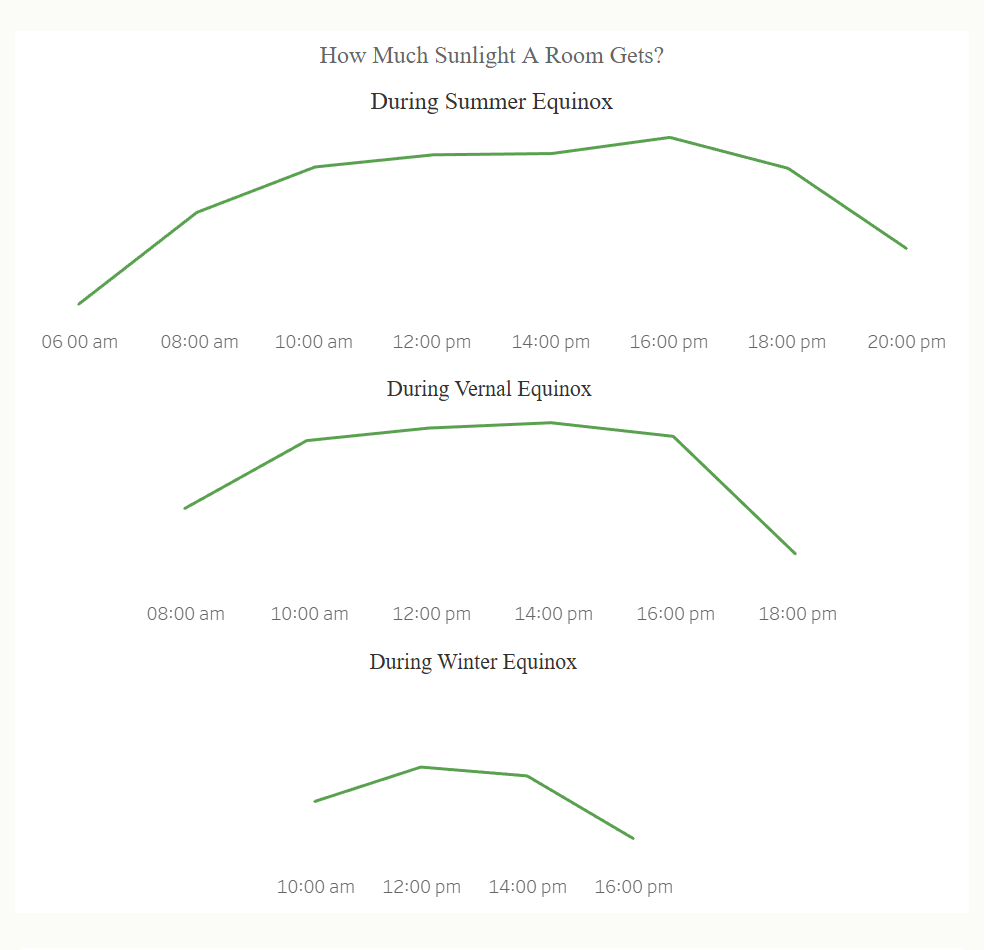
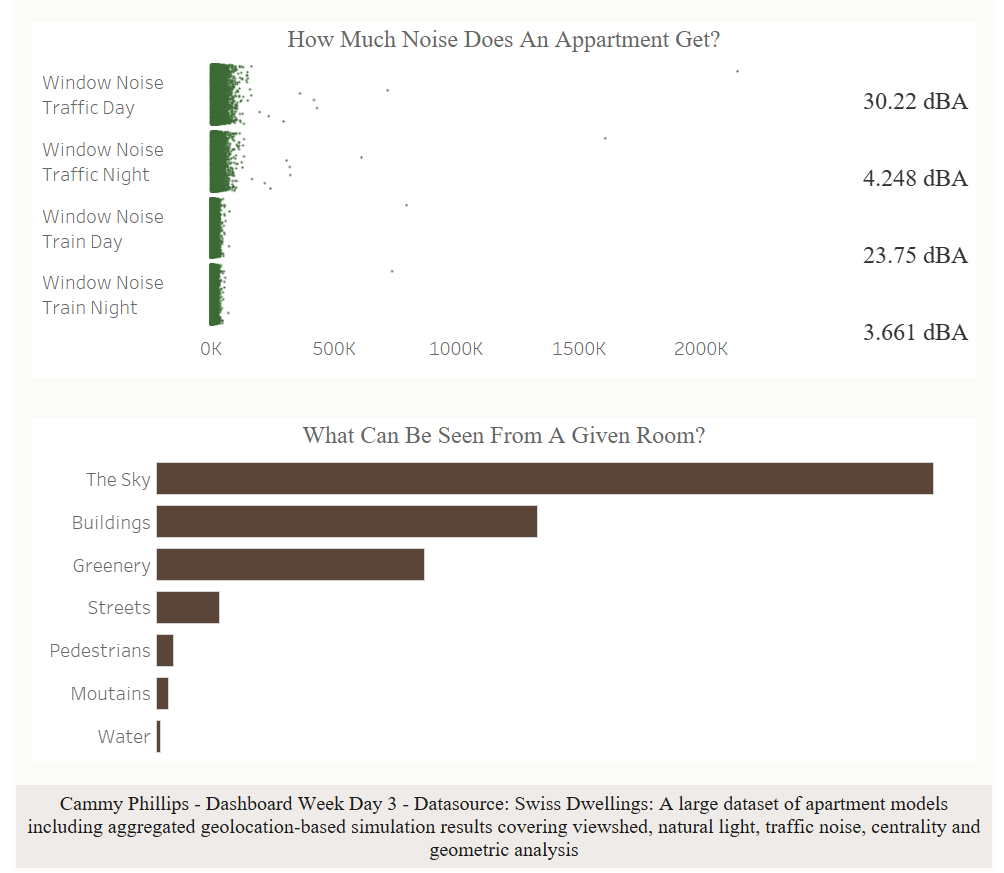
Next I went on to create my dashboard - Screenshots and a public link attached bellow. Initially the dashboard shows some how much certain factors influence all rooms, then using the parameter at the top of the dashboard to allow a user to filter down to certain scenarios/ rooms.
Some tips for working with big data include:
- Try to filter out as much as you can as early as possible - this can mean picking a story for your data and sticking with it
- Extract your data as this will work more quickly in tableau
- In alteryx, it may be quicker to initially output your data as a .yxdb file and put that into your workflow as this can be easier to process
- Using databases (such as snowflake) can also be really useful if you have access to them as they are build to processes very large data sources