


When you want to provide a bar chart with a limited number of bars, the Top N filter is an option. The Top N filter allows a user to select the number of bars they would like to see on a bar chart and sorted by a predefined field.
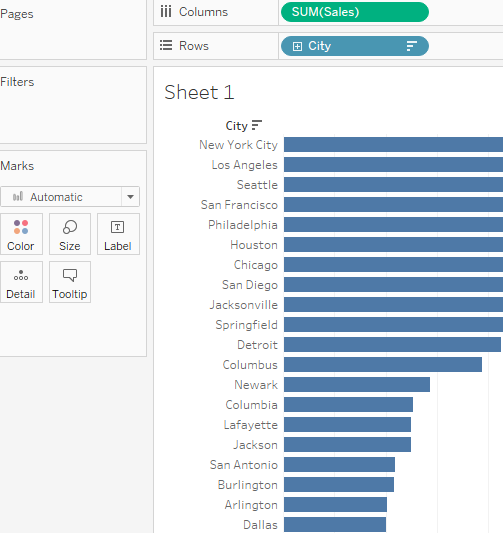
Let’s start with a bar chart of cities ordered by their sales. There are too many cities and a user might prefer to just see the cities with the top sales. At the same time, we also want to provide the user with the option of how many cities they would like to see.
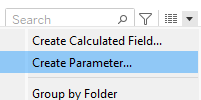
We can start creating the Top N filter by creating a parameter.
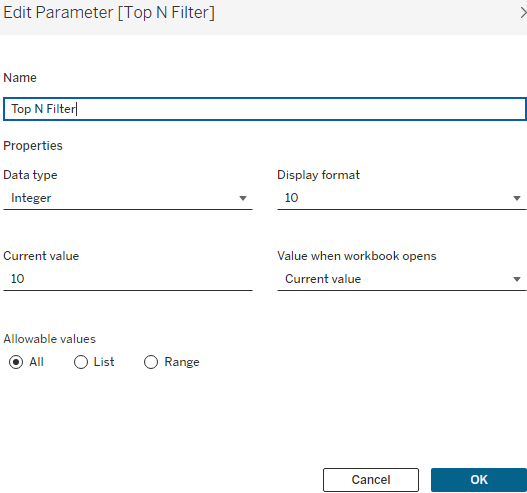
Make sure to show the parameter and set your default value. I will set the default value to 10.
Next we will add the filter onto the field.
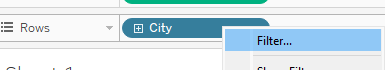
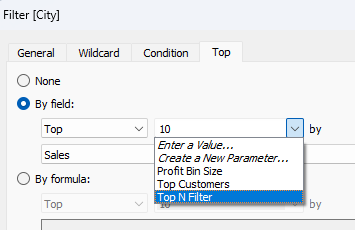
Select the Top N filter in the top section. Note that we are sorting by top sum of sales in this situation.

Now we have a dynamic Top N filter!
Photo by Say Cheeze Studios on Unsplash